
Move the Dots: A Simple Scale for Hondest Math Goal-Setting
How two school teams used four words (none, few, many, most) to set honest math goals for productive disposition and student reasoning, and then figured out what would move the dots.
Two Teams, Two Goals, One Scale
Recently, two teams I support set goals for very different things. One wants to strengthen students' productive disposition, so students are more curious, take more risks, and approach math with more confidence. The other wants to increase students' ability to explain their thinking and justify their reasoning.
Different schools, different objectives. But both ended up using the same four words to figure out where they stood: none, few, many, most.
That scale has become one of my favorite tools for goal-setting, because it solves a problem almost every math leader runs into. The goals we care about most are often the hardest to measure.
Key Takeaways
Goals like productive disposition and student reasoning are hard to measure with test scores. A simple none, few, many, most scale makes them visible: define success as what students do and say, have each teacher place a dot for how many students consistently show it, then commit to what will move the dots and check perception against student work.
- Define what success looks like in terms of what students actually do and say.
- Put your dot on the line: none, few, many, or most of my students consistently demonstrate it.
- Ask what will move the dots, and pair perception with real evidence.
The Problem With Goals We Can't See, Like Productive Disposition
To understand why that mattered, it helps to go back to what we noticed during our first visit.
How the Try-Discuss-Connect Framework Is Designed to Work
The school uses i-Ready Classroom Mathematics, and its Develop sessions follow a Try-Discuss-Connect framework (Curriculum Associates, 2024a). The Try It comes first. Students make sense of the problem together, often through a language routine like Three Reads or Notice and Wonder, and then get individual think time to solve it with whatever tools, models, or strategies make sense to them.
The curriculum is clear about the teacher's role in that moment: circulate, notice the representations students are using, and resist the temptation to explain or show them how to approach the problem. It even reminds teachers that it's okay if not every student reaches a solution yet.
Then, in Discuss It, students share their thinking with a partner while the teacher selects and sequences strategies for a whole-class conversation, and in Connect It, the class links those strategies to the model in the lesson. That's where the teacher elicits evidence of student thinking, one of NCTM's (2014) Effective Mathematics Teaching Practices, and connects it to the day's learning.
What Was Happening Instead
That's not what we saw. In many classrooms, teachers were walking students through the Try It step by step, and students were following along. It wasn't even "I do, we do, you do." It was mostly "we do," with everyone working through the problem together while the teacher led the way. Without that independent think time, there was very little student thinking for the Discuss It and Connect It to build on. It's a good reminder that using a high-quality math curriculum isn't the same as landing the lesson.
Why the Gap Mattered: The Team's Vision
That gap mattered because of the vision this team had written together:
Students own their mathematical thinking and act as mathematicians by talking, reasoning, and problem-solving with peers, taking risks, and persisting through challenge with curiosity. Teachers facilitate this ownership through questioning, responsive instruction, and space for students to lead.
The team saw the Try It as a small, specific place where they could start living that vision. If students were going to own their thinking, this was the moment in the lesson built for it.
Teachers Didn't Just Share the Work, They Replicated It
Think about how most improvement goals get written. "Students will explain their thinking." "Students will develop a productive disposition toward math." These are the right things to want, but they're vague enough that a team can work on them all year without knowing whether anything changed.
Test scores don't help much here, either. A score can tell you whether a student got the answer right. It can't tell you whether they chose their own strategy, took a risk, or could explain why their approach worked.
So before a team can set a meaningful key result, they need two things: a clear picture of what success looks like, and an honest sense of where students are right now. The none, few, many, most scale gives them both.
Step 1: Write Success Criteria for What Students Do and Say
The scale only works if everyone agrees on what they're rating, so the first step is always to define success in terms of what students actually do and say. (If you've ever watched a team discover that four leaders meant four different things by the same goal, you know why this matters. Here's what one team changed when they realized their shared goal wasn't actually shared.)
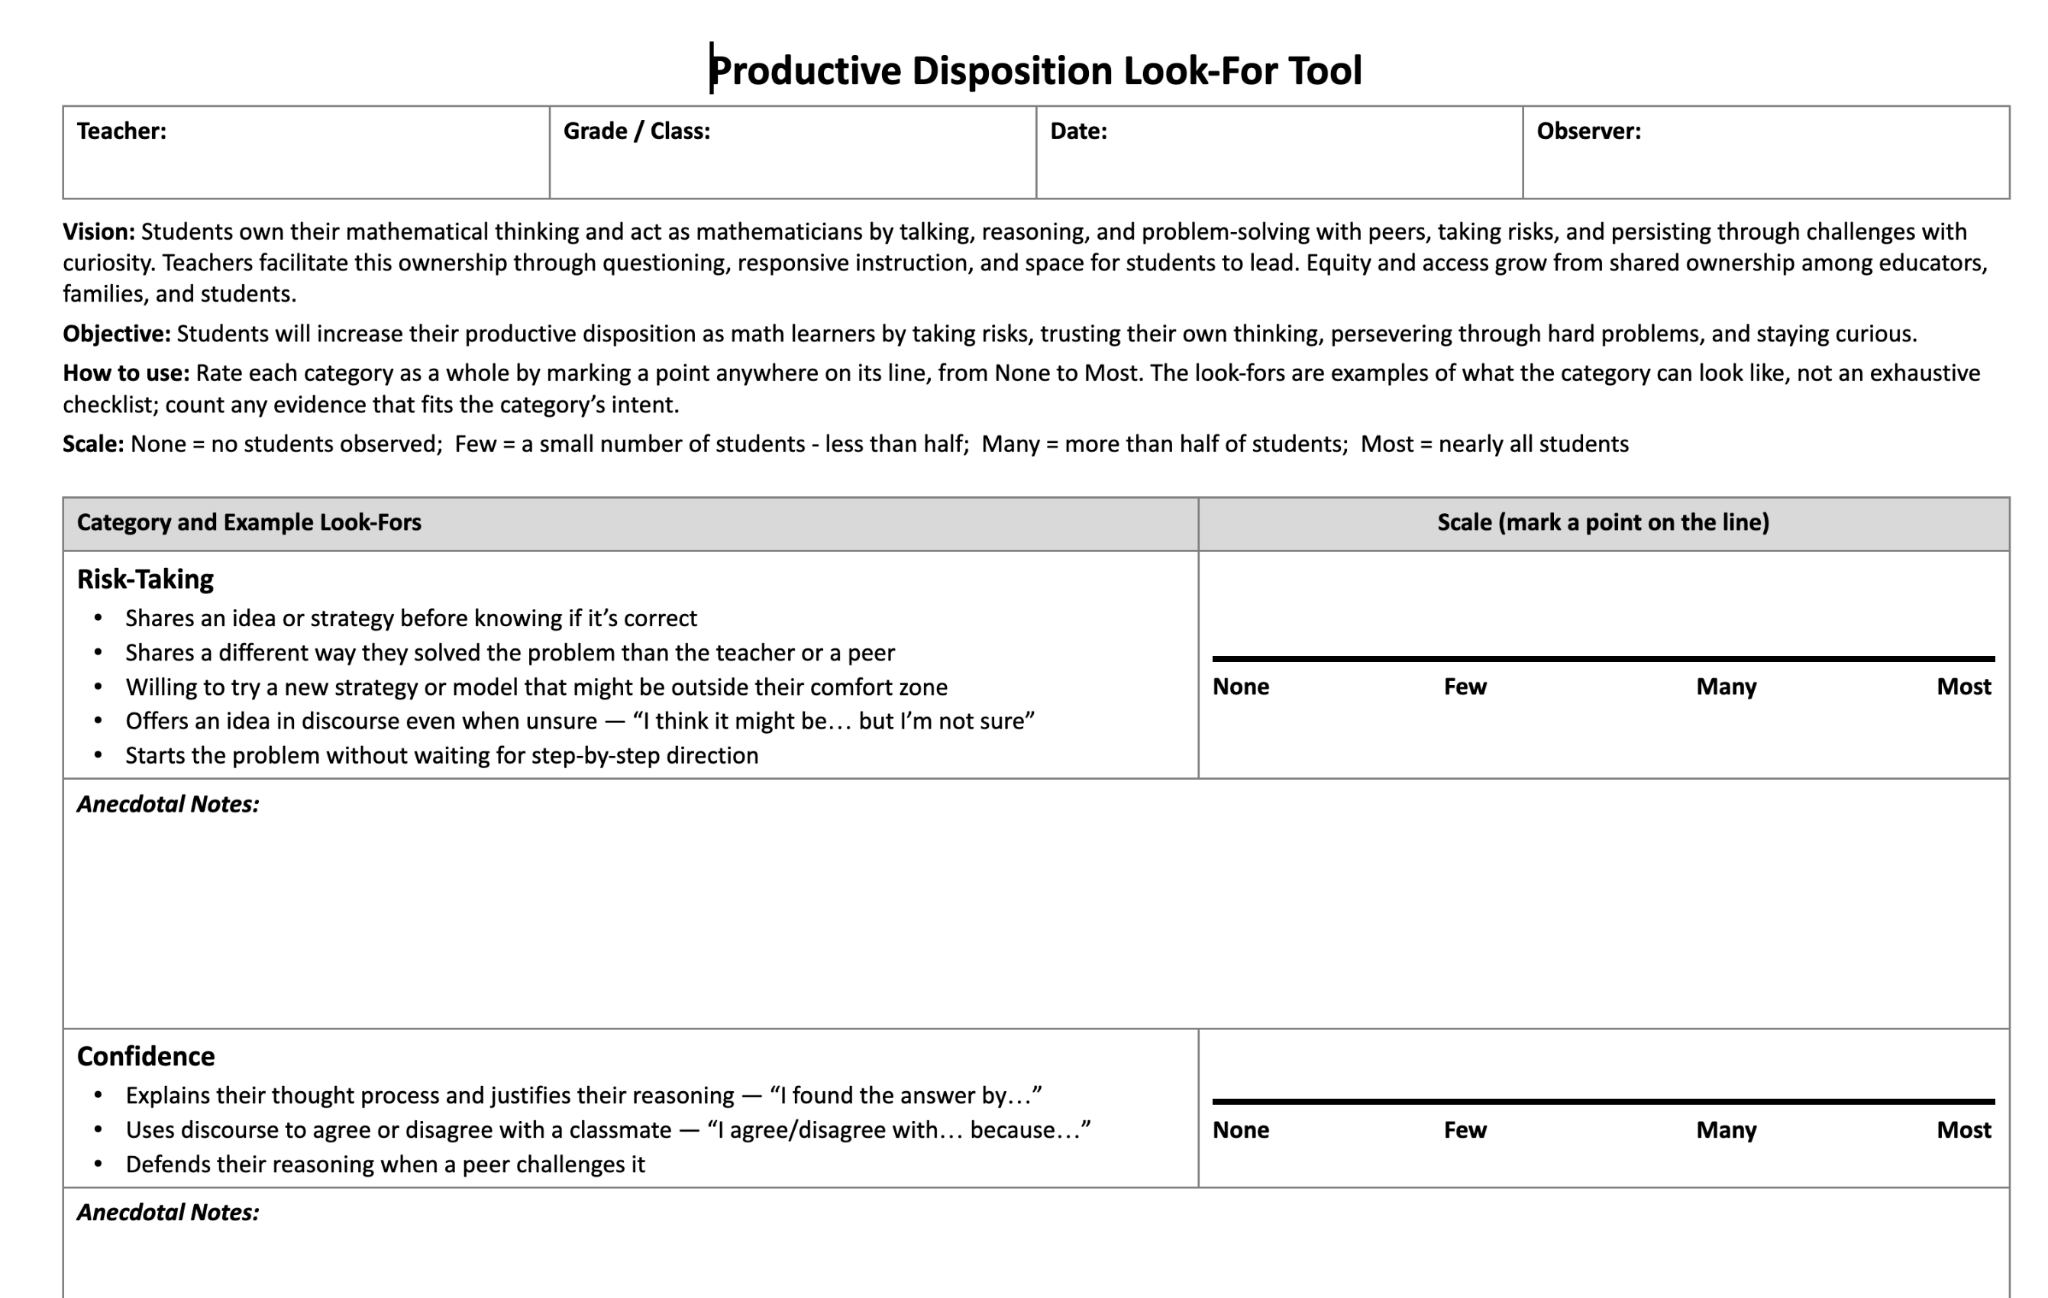
Success Criteria for Productive Disposition in Math
With the productive disposition team, we asked a series of questions:
- If a student is curious, what are they doing?
- If a student is taking a risk, what does that sound like?
- If a student is confident, what do we see?
We compiled their answers into a set of success criteria, so "productive disposition" stopped being a slogan and became a list of observable behaviors.
Success Criteria for Explaining and Justifying Reasoning
With the team focused on explaining and justifying, we took the same approach and landed on a single statement teachers could reflect against: students can independently select from a variety of models, based on the context, the numbers, and their own developmental readiness, to solve a rich task.
The key word in that statement is independently. What this team really wants is flexibility. They want students to have a full enough toolkit that they get to choose, rather than mimicking whatever the teacher modeled or reaching for a strategy that's inefficient for the problem in front of them.
Reasoning implies a choice. A student who can explain why they chose their approach is doing something very different from a student who followed the steps they were shown.
Step 2: Put Your Dot on the None, Few, Many, Most Scale
Once success is defined, each teacher thinks about their own students and places a dot on a continuum. How many of my students consistently demonstrate these behaviors? None, few, many, or most?
Why "None, Few, Many, Most" Beats "Occasionally" and "Routinely"
The labels matter. When we first built the continuum with the productive disposition team, I suggested words like "occasionally" and "routinely." They preferred none, few, many, most, and I think they were right. Those words keep the focus on students rather than on the teacher, and they're simple enough that everyone uses them the same way.
Seeing the Current Reality: A Lesson From The Oz Principle
You can probably guess where the dots landed. Nobody put their dot at "most." A few teachers placed theirs at "few," and some placed theirs even lower.
That's not a failure. It's the first honest look at the current reality, and that's exactly the point. In The Oz Principle, Connors, Smith, and Hickman (1994) describe the first step of accountability as seeing it, acknowledging the full reality of a situation before trying to change it. The dots make that reality visible, and because every teacher placed one, the whole team owns it.
Not sure which objective is worth measuring first? The free Math Improvement Plan Assessment takes about 12 minutes and gives you a custom report on where your math program's greatest need is right now.
Step 3: Ask What Will Move the Dots
Once the dots are on the line, the goal becomes simple. We just need to move them. We need more students demonstrating more of these behaviors more consistently.
That's where the key result comes in. (If you want a deeper look at writing them, see how to write key results that actually tell you something.) The question for the team is: what will we commit to this quarter that will move our dots? Keeping that commitment to a single quarter is the same idea behind setting realistic short-term milestones instead of waiting years to see change.
For the productive disposition team, that led to a specific shift in how teachers facilitate one part of their lesson. (For an example of what a one-part-of-the-lesson shift can look like, read Productive Struggle in Math: One Small Shift Teachers Led.) For the team focused on explaining and justifying, it will come after they look closely at student work from a benchmark task.
Pair Perception With Evidence
There's one important caution. A dot is a teacher's perception, and perception is a starting point, not proof. That's why the team focused on explaining and justifying is pairing their reflection with real evidence. They'll:
- give a benchmark task that leaves room for many different models,
- sort the student work by the models students chose, and
- interview students whose thinking isn't clear from the page.
As they listen, they'll refine their success criteria based on what they actually hear. The dots tell a team where they think they are. The evidence tells them whether they're right.
Why the Scale Works for Productive Disposition and Reasoning Goals
What I love about this scale is how much it does with so little. It turns a vague goal into a shared definition of success. It gives teams an honest starting point without making anyone feel judged. And it makes progress visible, because next time the team places their dots, they can see whether they moved.
It also creates a common language. When the coach, the principal, and every teacher on a team are all asking "how many of our students are doing this consistently?", they're all working toward the same thing.
And once a team has an honest picture of where their students are, it opens the door to real ownership. If a team can show evidence that something other than the original focus is holding their students back, they can make the case for a different path toward the same objective. The objective stays fixed. How a team moves the dots can be theirs to decide.
Try It With Your Team: Measure Productive Disposition in Four Words
You don't need a new program to use this.
- Pick one objective your team cares about.
- Define what success looks like in terms of what students do and say.
- Have each teacher place a dot for how many of their students consistently demonstrate it: none, few, many, or most.
- Then ask the only question that matters next: what will we do to move the dots?
Your Next Step
If you'd like help finding the objective that matters most for your system, the free Math Improvement Plan Assessment is a quick place to start.
Frequently Asked Questions About Building a Professional Learning Community
What is productive disposition in math?
In this post, productive disposition means students who are more curious, take more risks, and approach math with more confidence. For goal-setting, the useful move is turning that phrase into observable behaviors: what a curious student is doing, what risk-taking sounds like, and what confidence looks like, so a team can actually see it.
How do you measure productive disposition in math?
Start by defining it as a list of observable student behaviors. Then have each teacher place a dot on a none, few, many, most continuum for how many students consistently show those behaviors. Treat the dots as a starting point, and check them against real evidence such as student work and conversations with students.
How do you write success criteria for a math goal?
Describe success in terms of what students actually do and say. One team asked what curious, risk-taking, and confident students do and compiled the answers into criteria. Another wrote a single statement: students can independently select from a variety of models, based on the context, the numbers, and their readiness, to solve a rich task.
What is the none, few, many, most scale?
It's a four-point continuum teachers use to estimate how many of their students consistently demonstrate a defined behavior: none, few, many, or most. The words keep attention on students rather than on the teacher, and they're simple enough that everyone on a team uses them the same way, which creates a common language.
Why are goals like explaining thinking so hard to measure?
Because a test score mostly shows whether an answer was right. A score can't tell you whether a student chose their own strategy, took a risk, or could explain why their approach worked. Goals like these need a clear picture of what success looks like and an honest read of where students are right now.
Is a teacher's rating enough to show progress?
No. A dot is a teacher's perception, and perception is a starting point, not proof. Pair it with evidence: give a benchmark task that allows many different models, sort student work by the models students chose, and interview students whose thinking isn't clear from the page. Then refine your success criteria.
References
Connors, R., Smith, T., & Hickman, C. (1994). The Oz principle: Getting results through individual and organizational accountability. Prentice Hall. (Link goes to the publisher's page for the current revised edition, not the 1994 edition cited.)
About the Author
Yvette Lehman is Chief Academic Officer at Make Math Moments, where she coaches state, district, and school math teams through their improvement work and co-hosts the Making Math Moments That Matter podcast with Jon Orr. Yvette struggled with math as a student, and visual models changed how she saw it. That experience drives her focus on conceptual understanding and elementary progressions.