Solving Proportions With The Toronto Maple Leafs Win:Loss Ratio
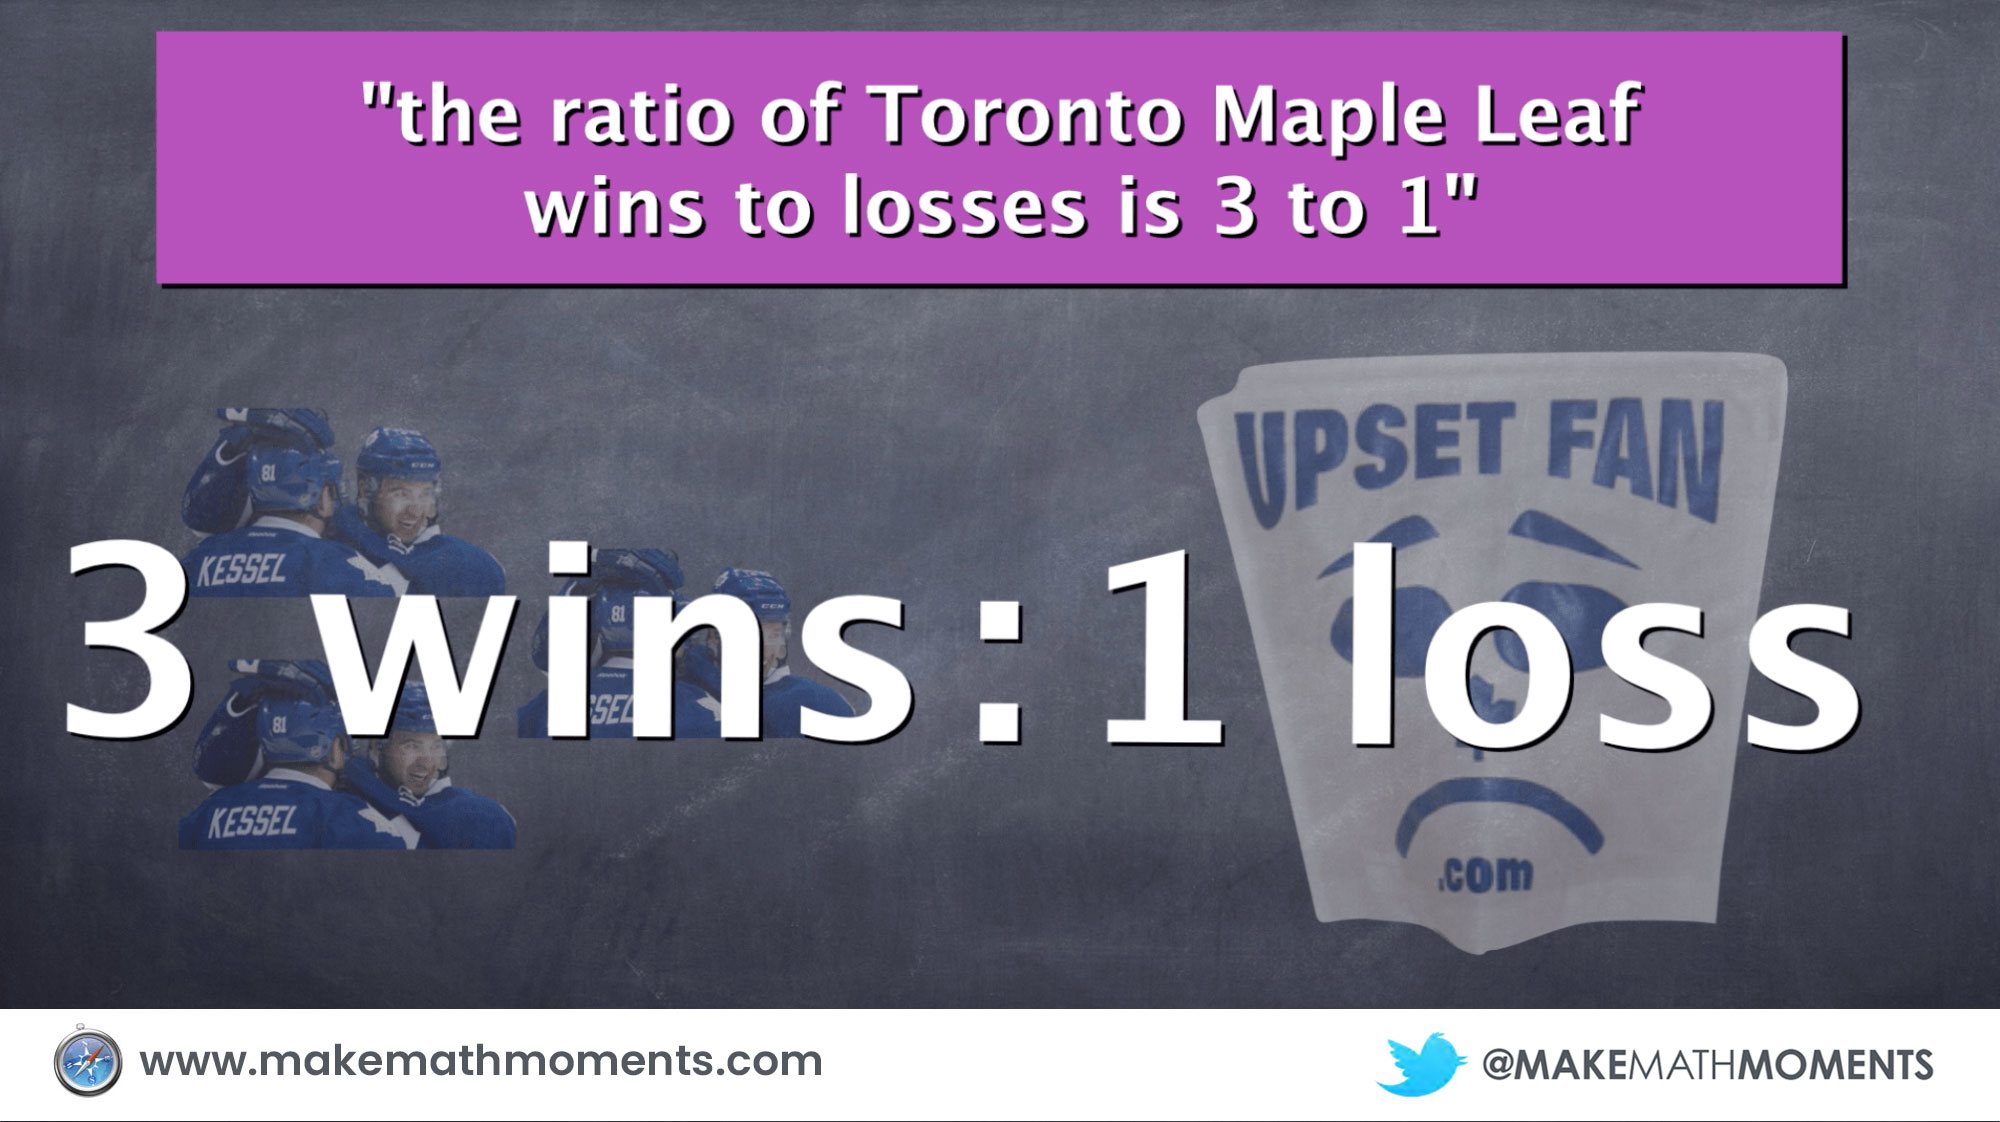
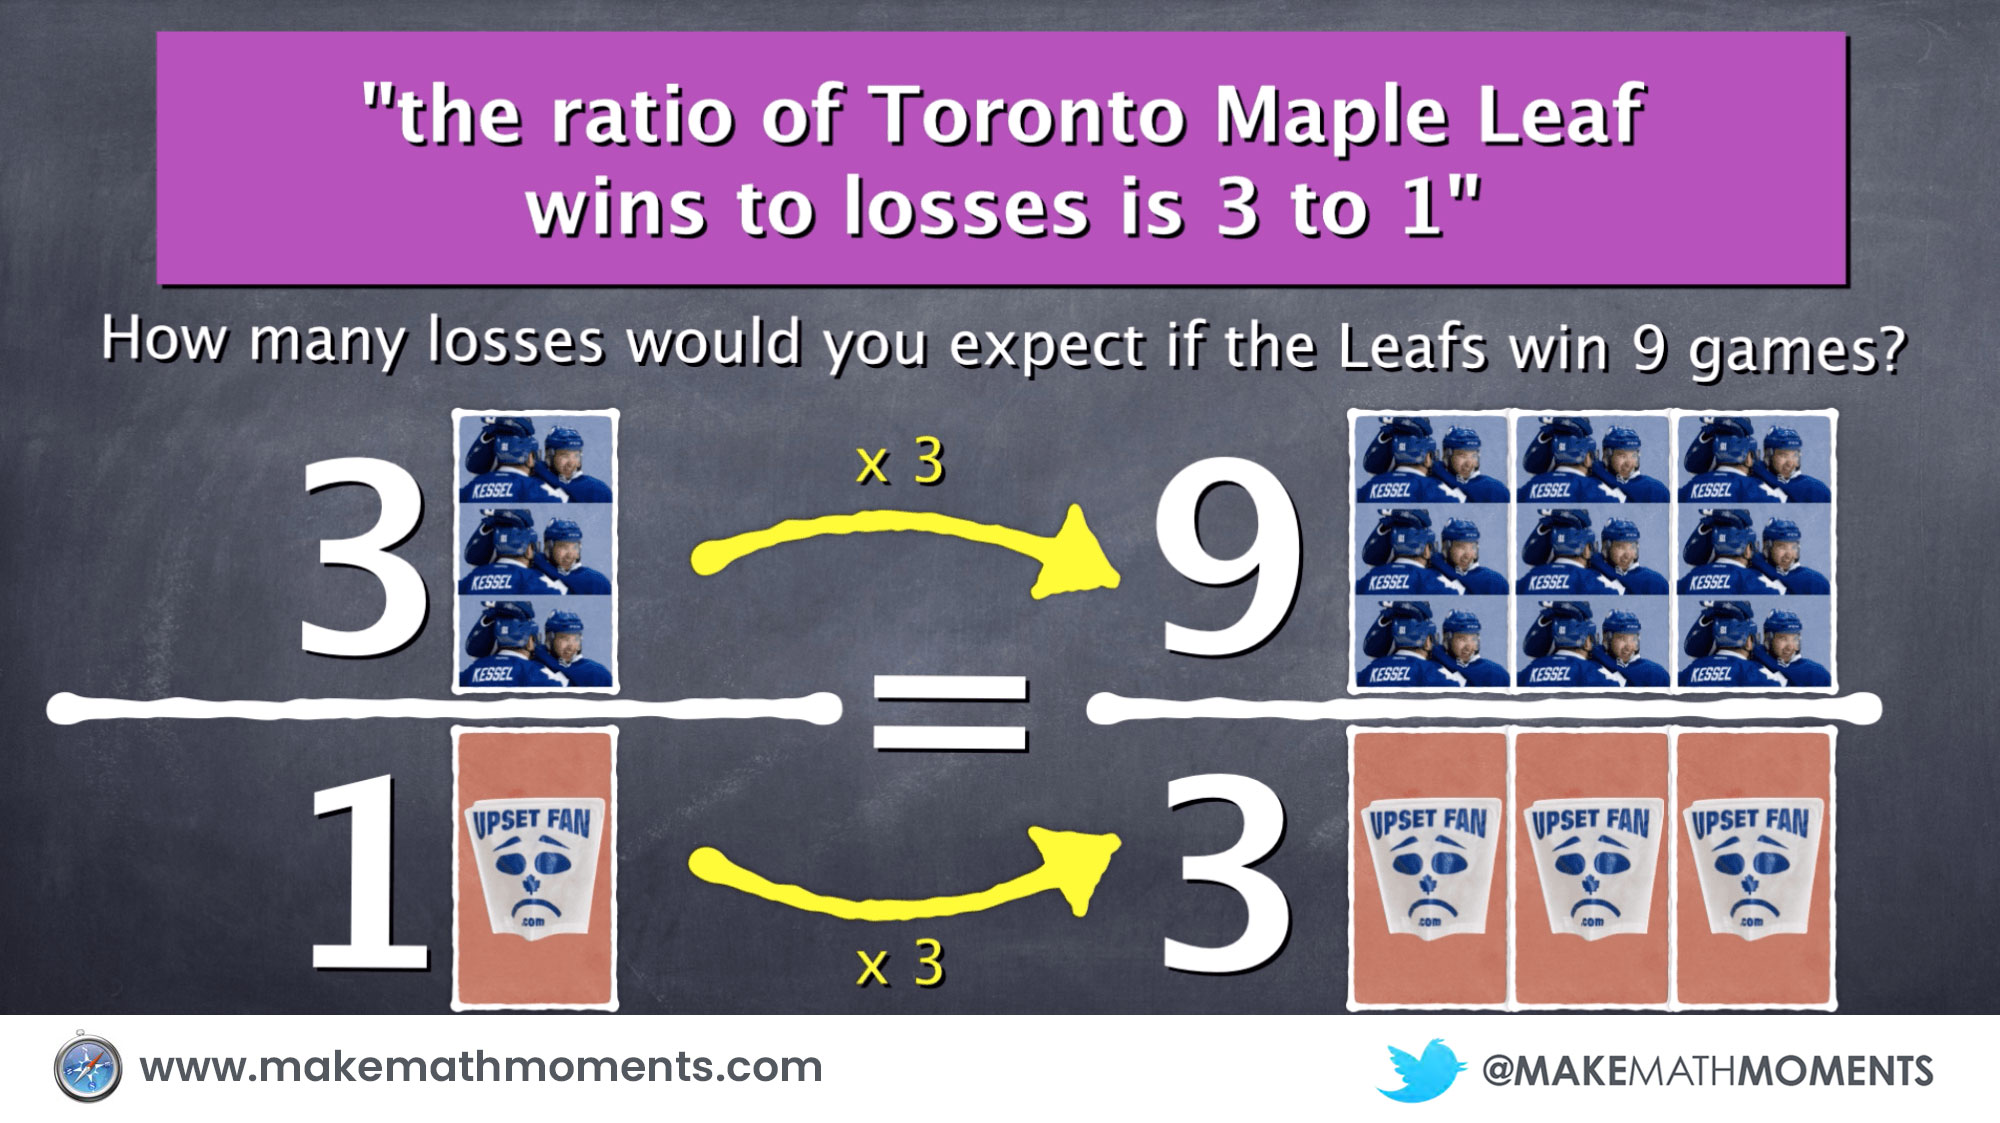
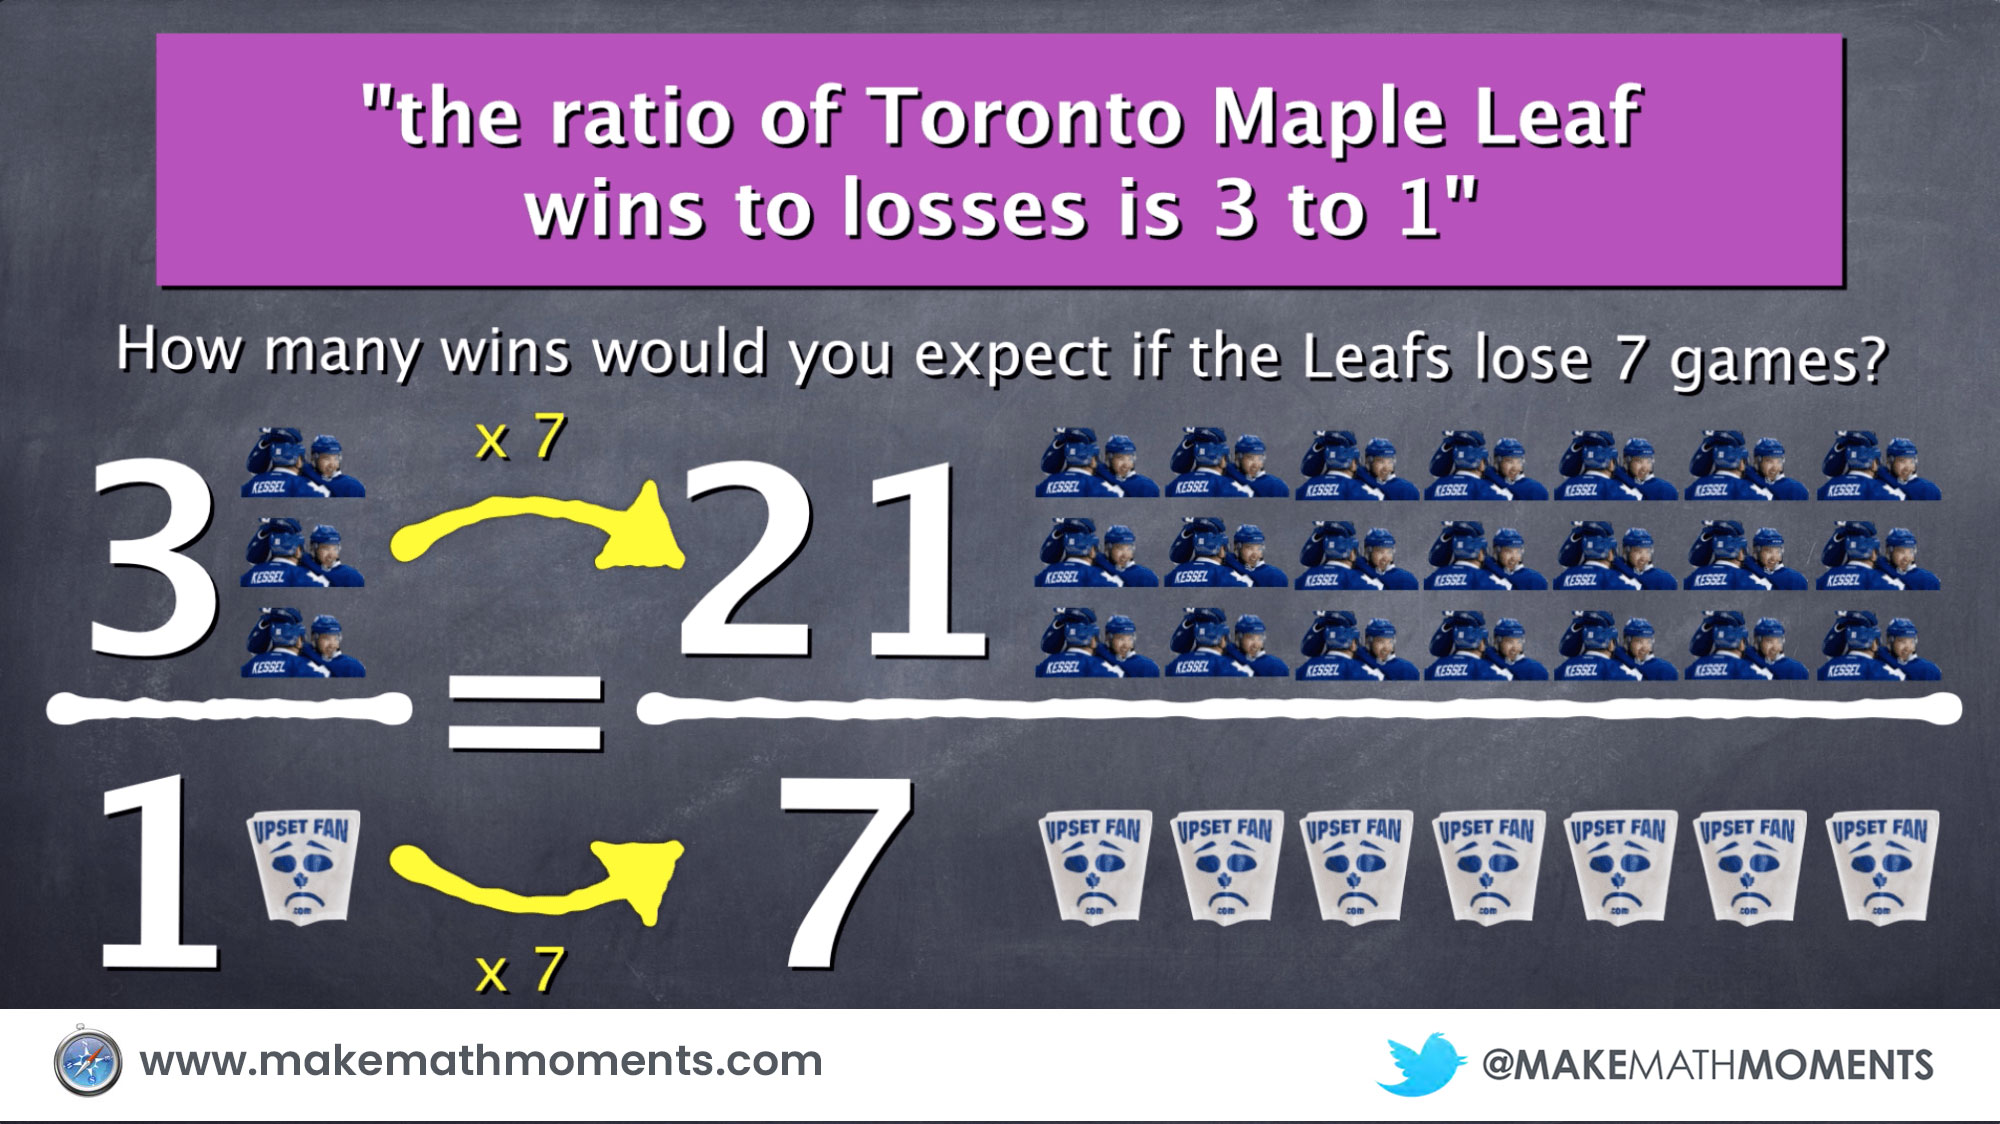
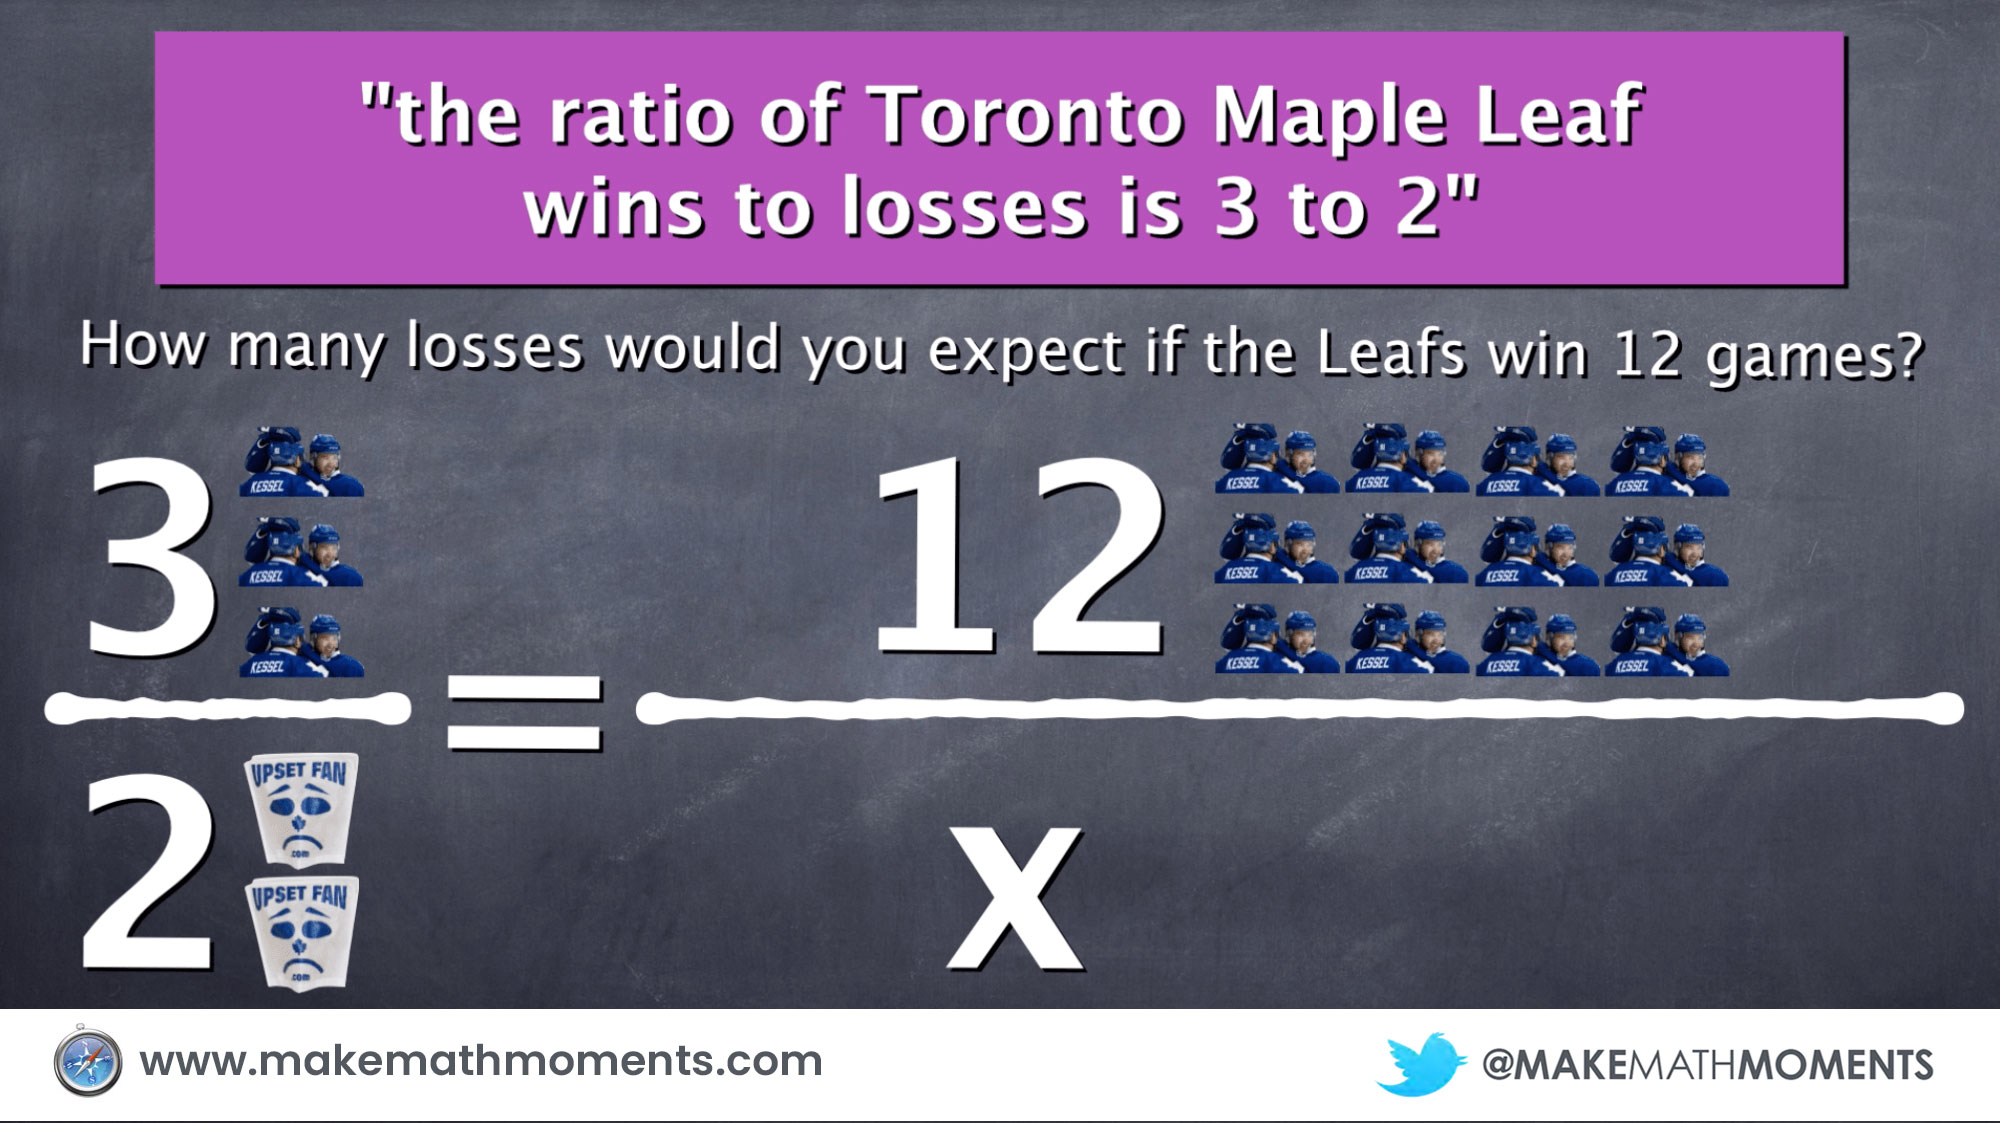
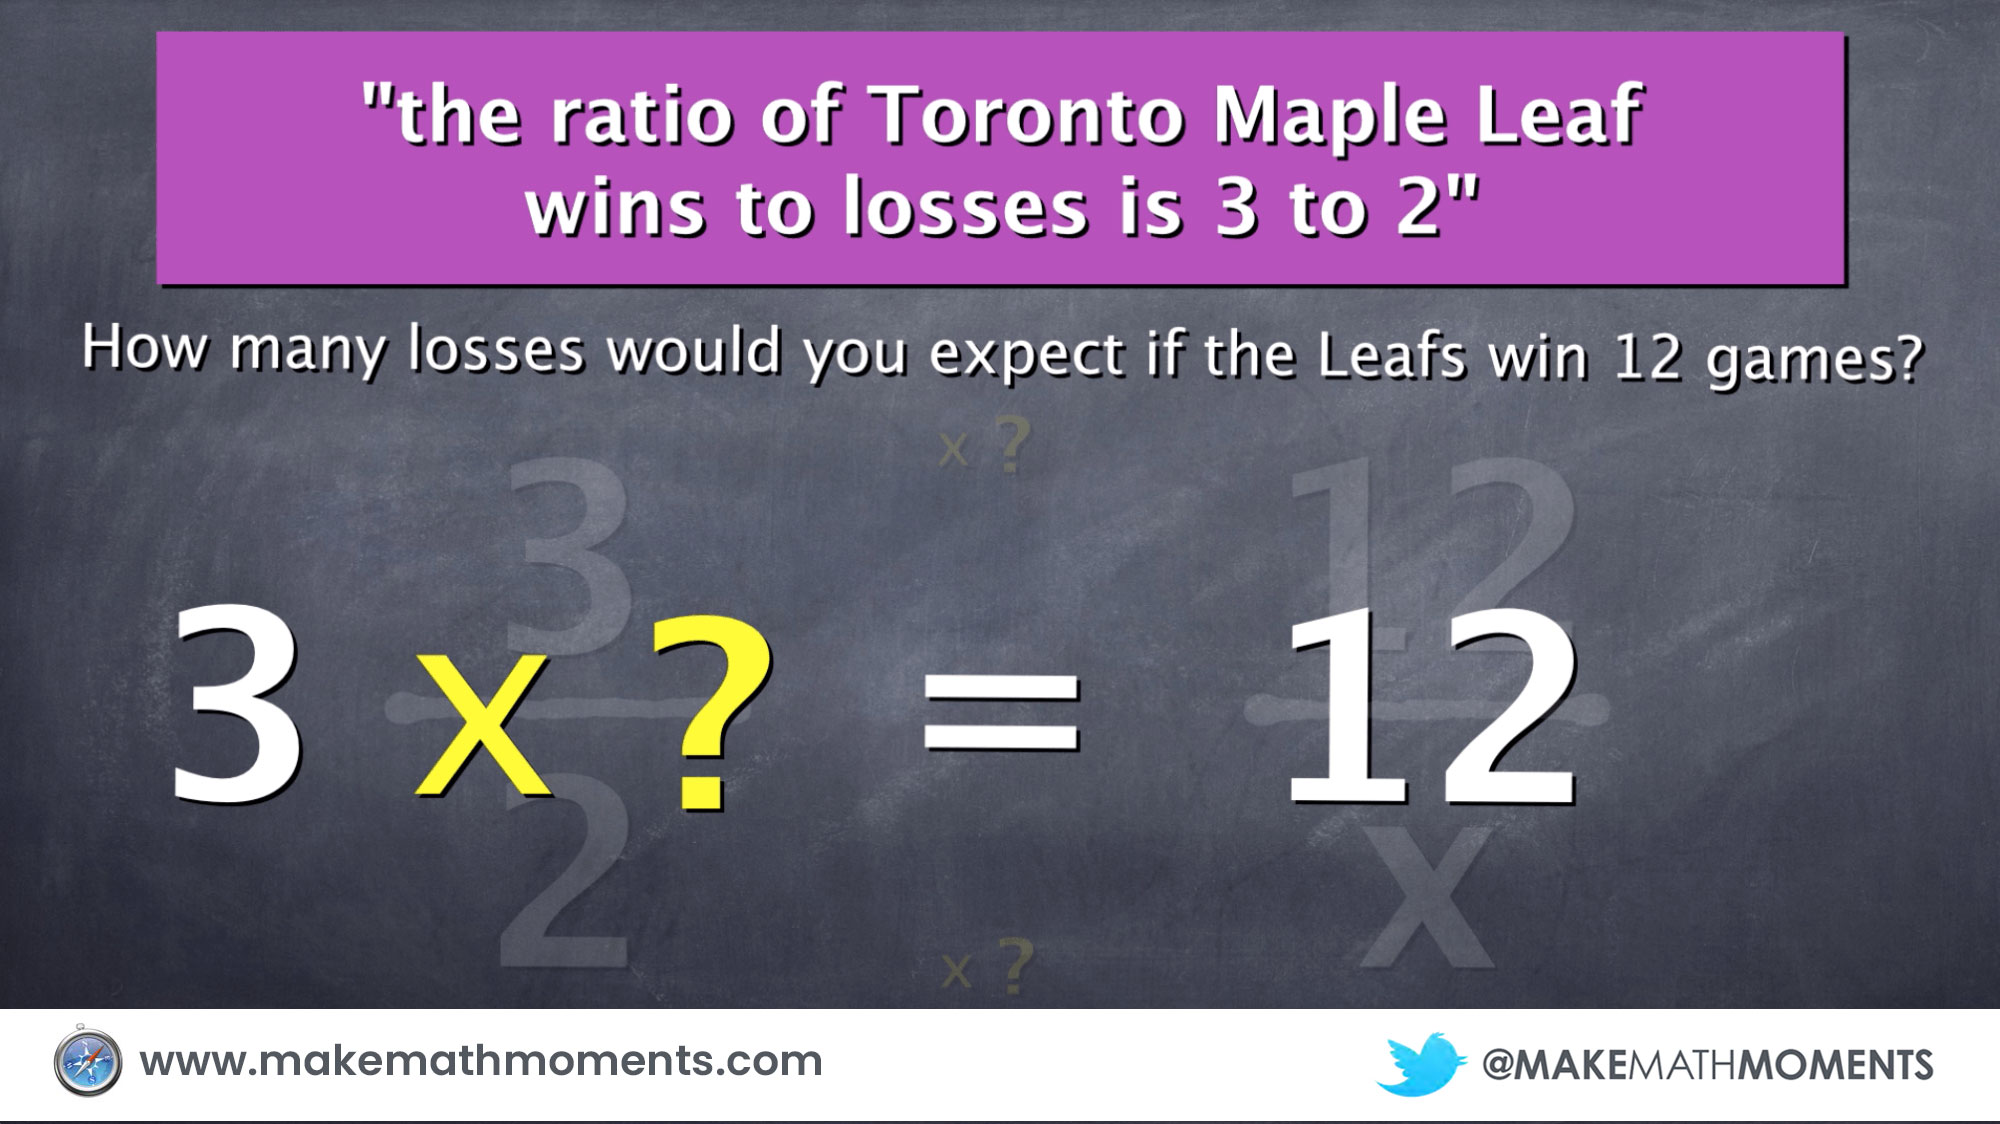
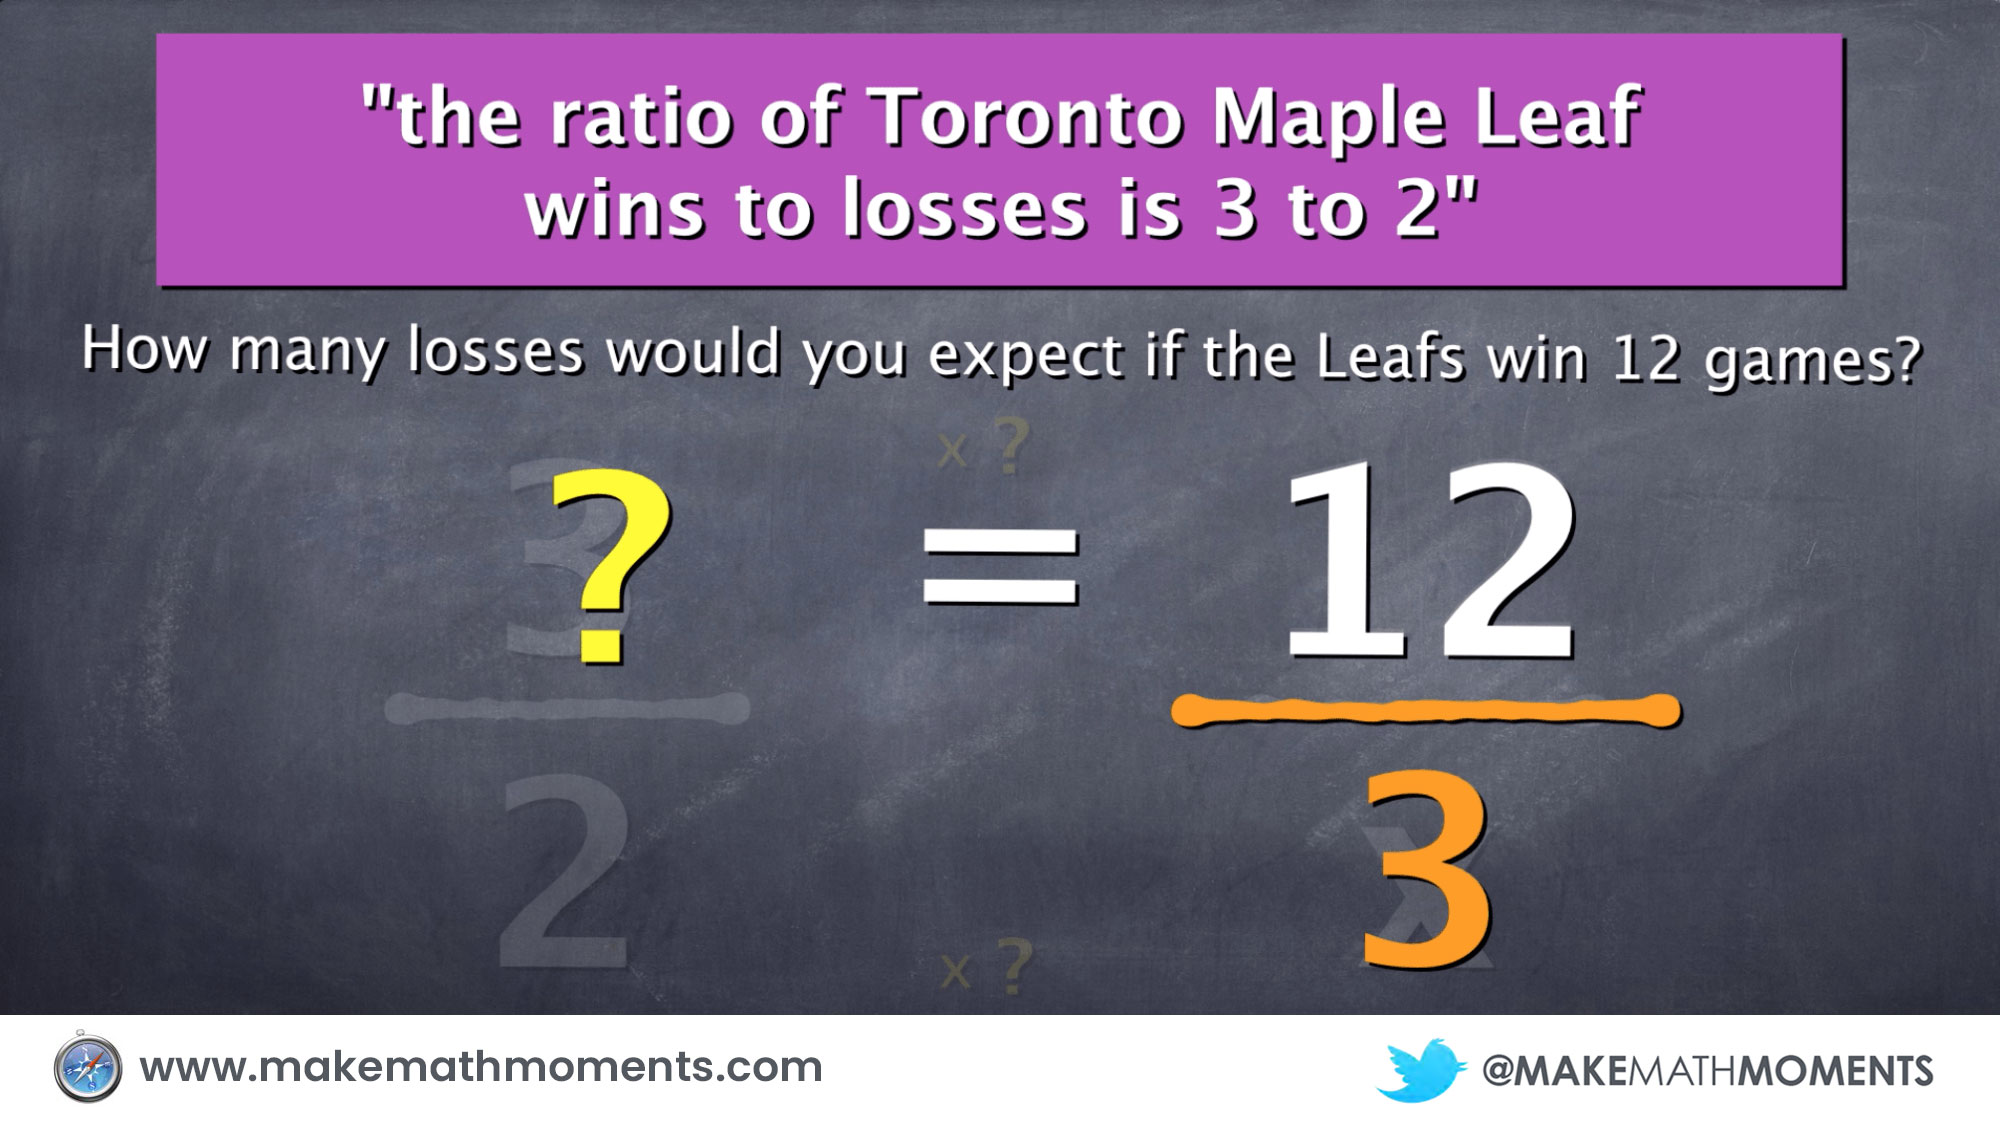
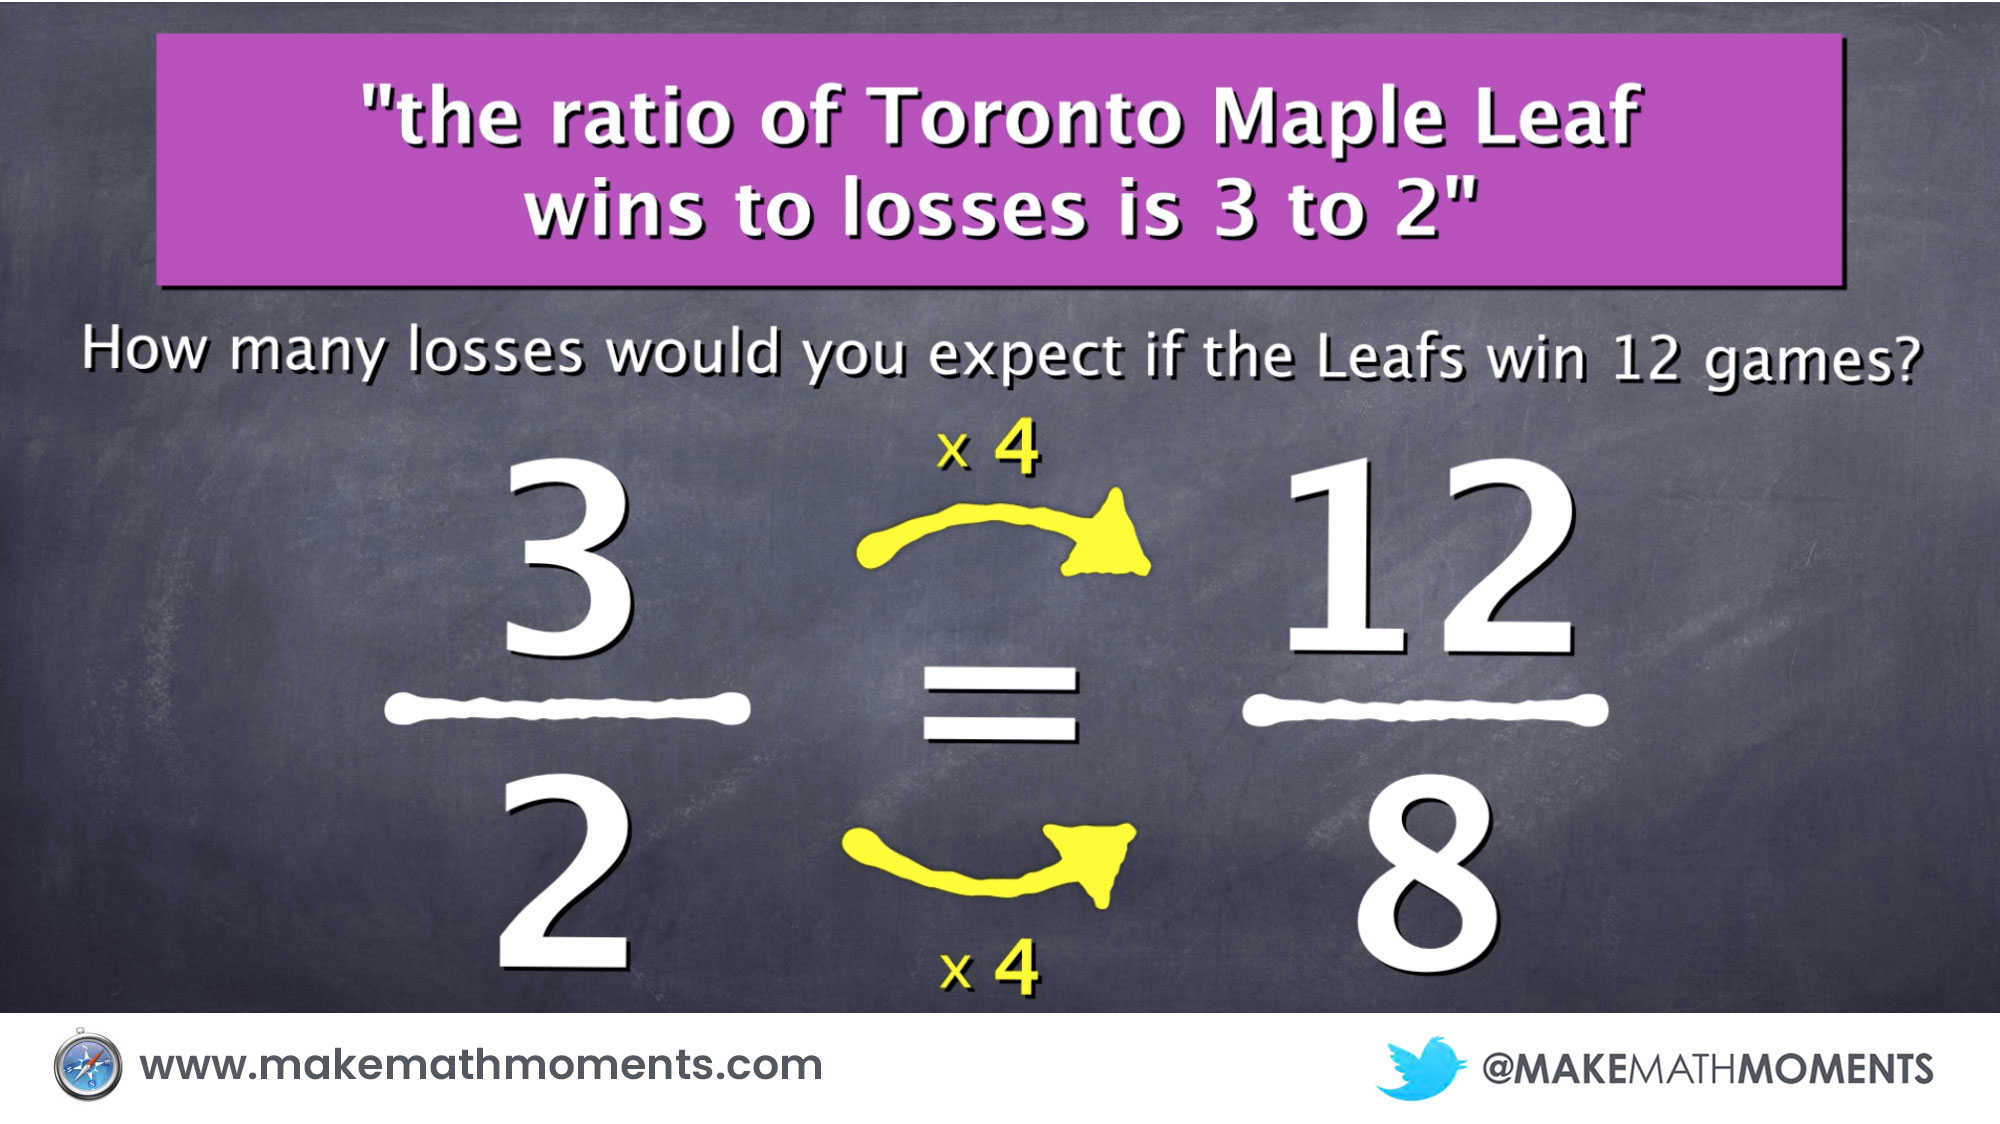
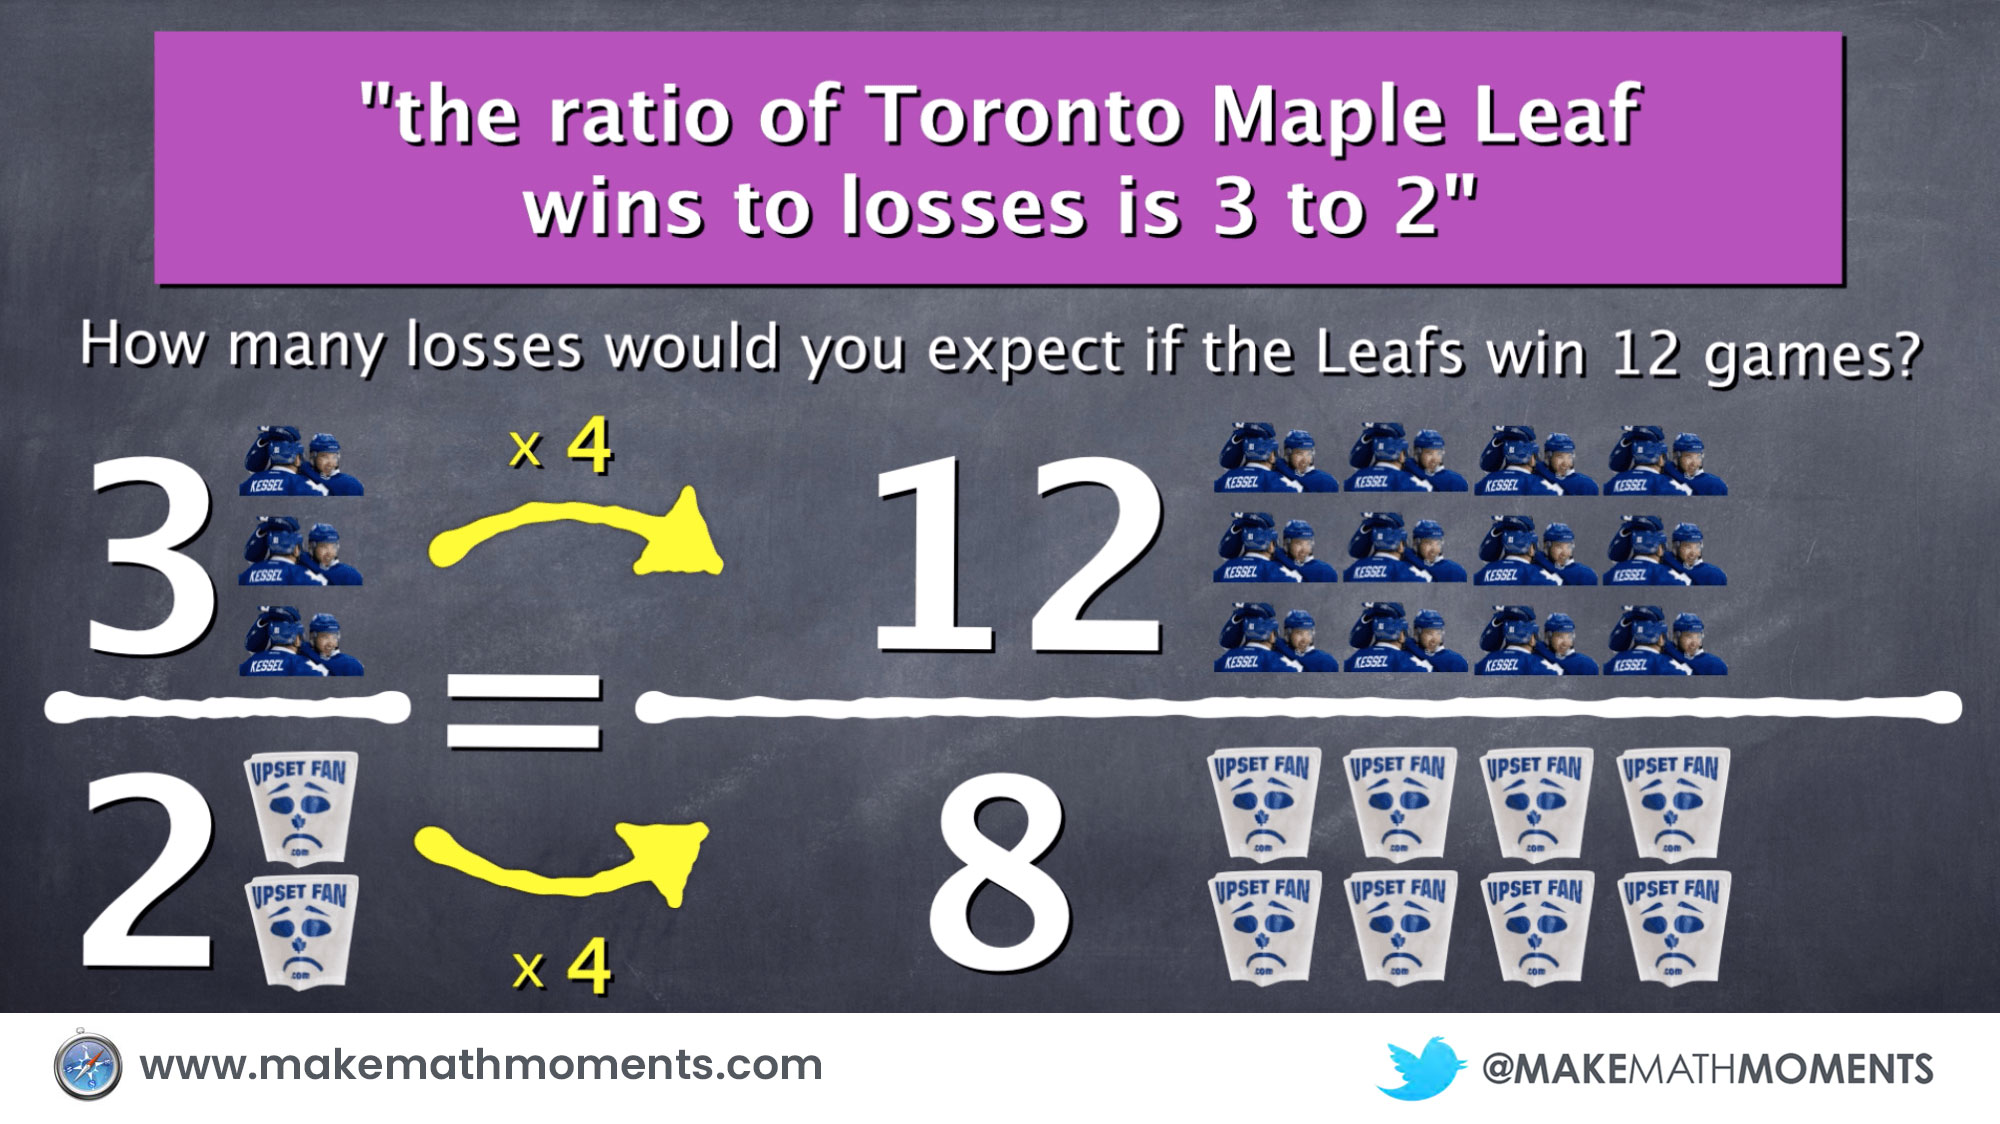
As we began the Proportional Reasoning unit in my MFM1P Grade 9 Math Course, I was beginning to struggle with an idea to extend the idea of visualizing mathematics concepts into ratios, rates, and proportions. What I came up with was using a visual representation of Toronto Maple Leaf wins and losses in order to help scaffold students slowly from concrete examples to the algebraic representation utilizing a proportion of equivalent fractions. This could be a good way for you to understand the rankings and wins and losses of your fantasy hockey teams.
If you’re not into watching the video, you can see some screenshots below.
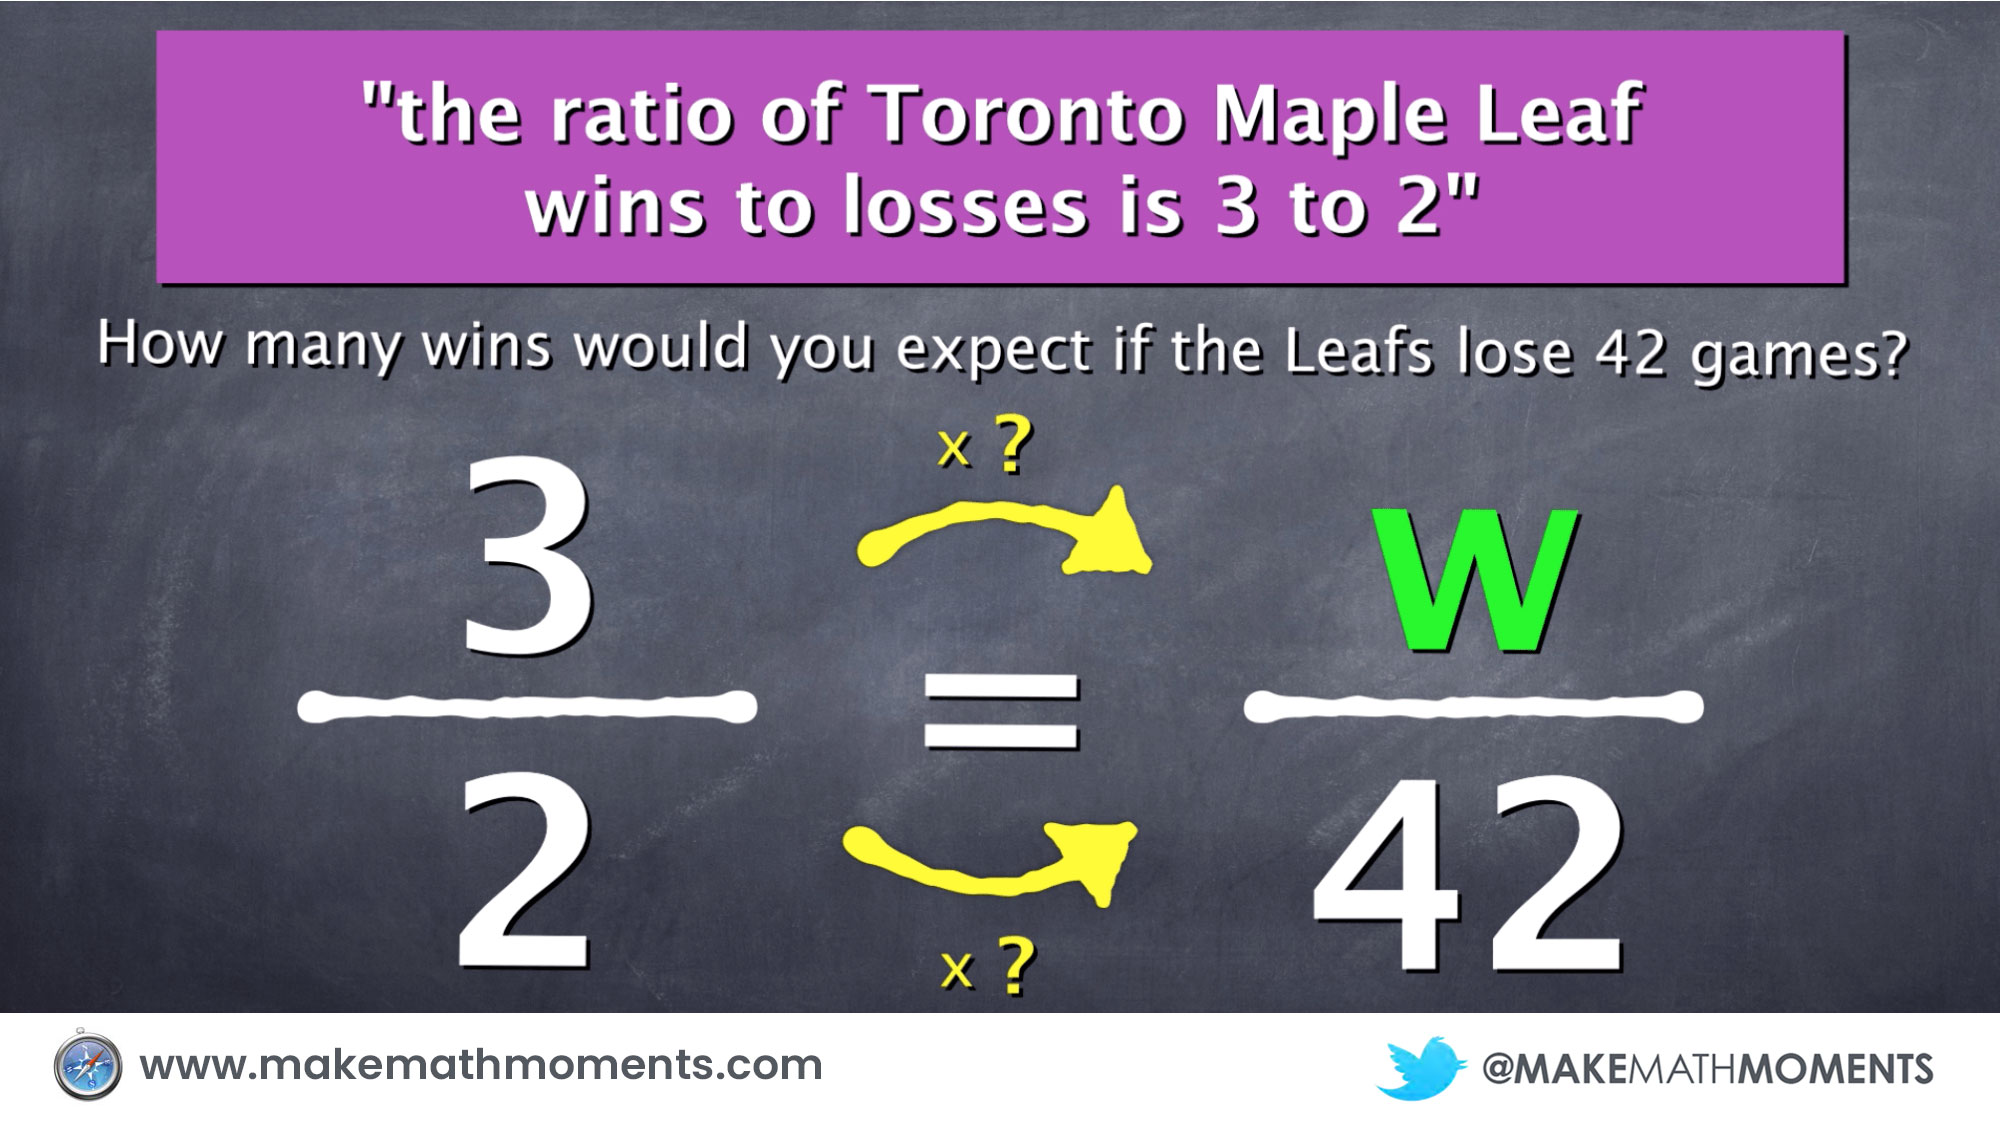
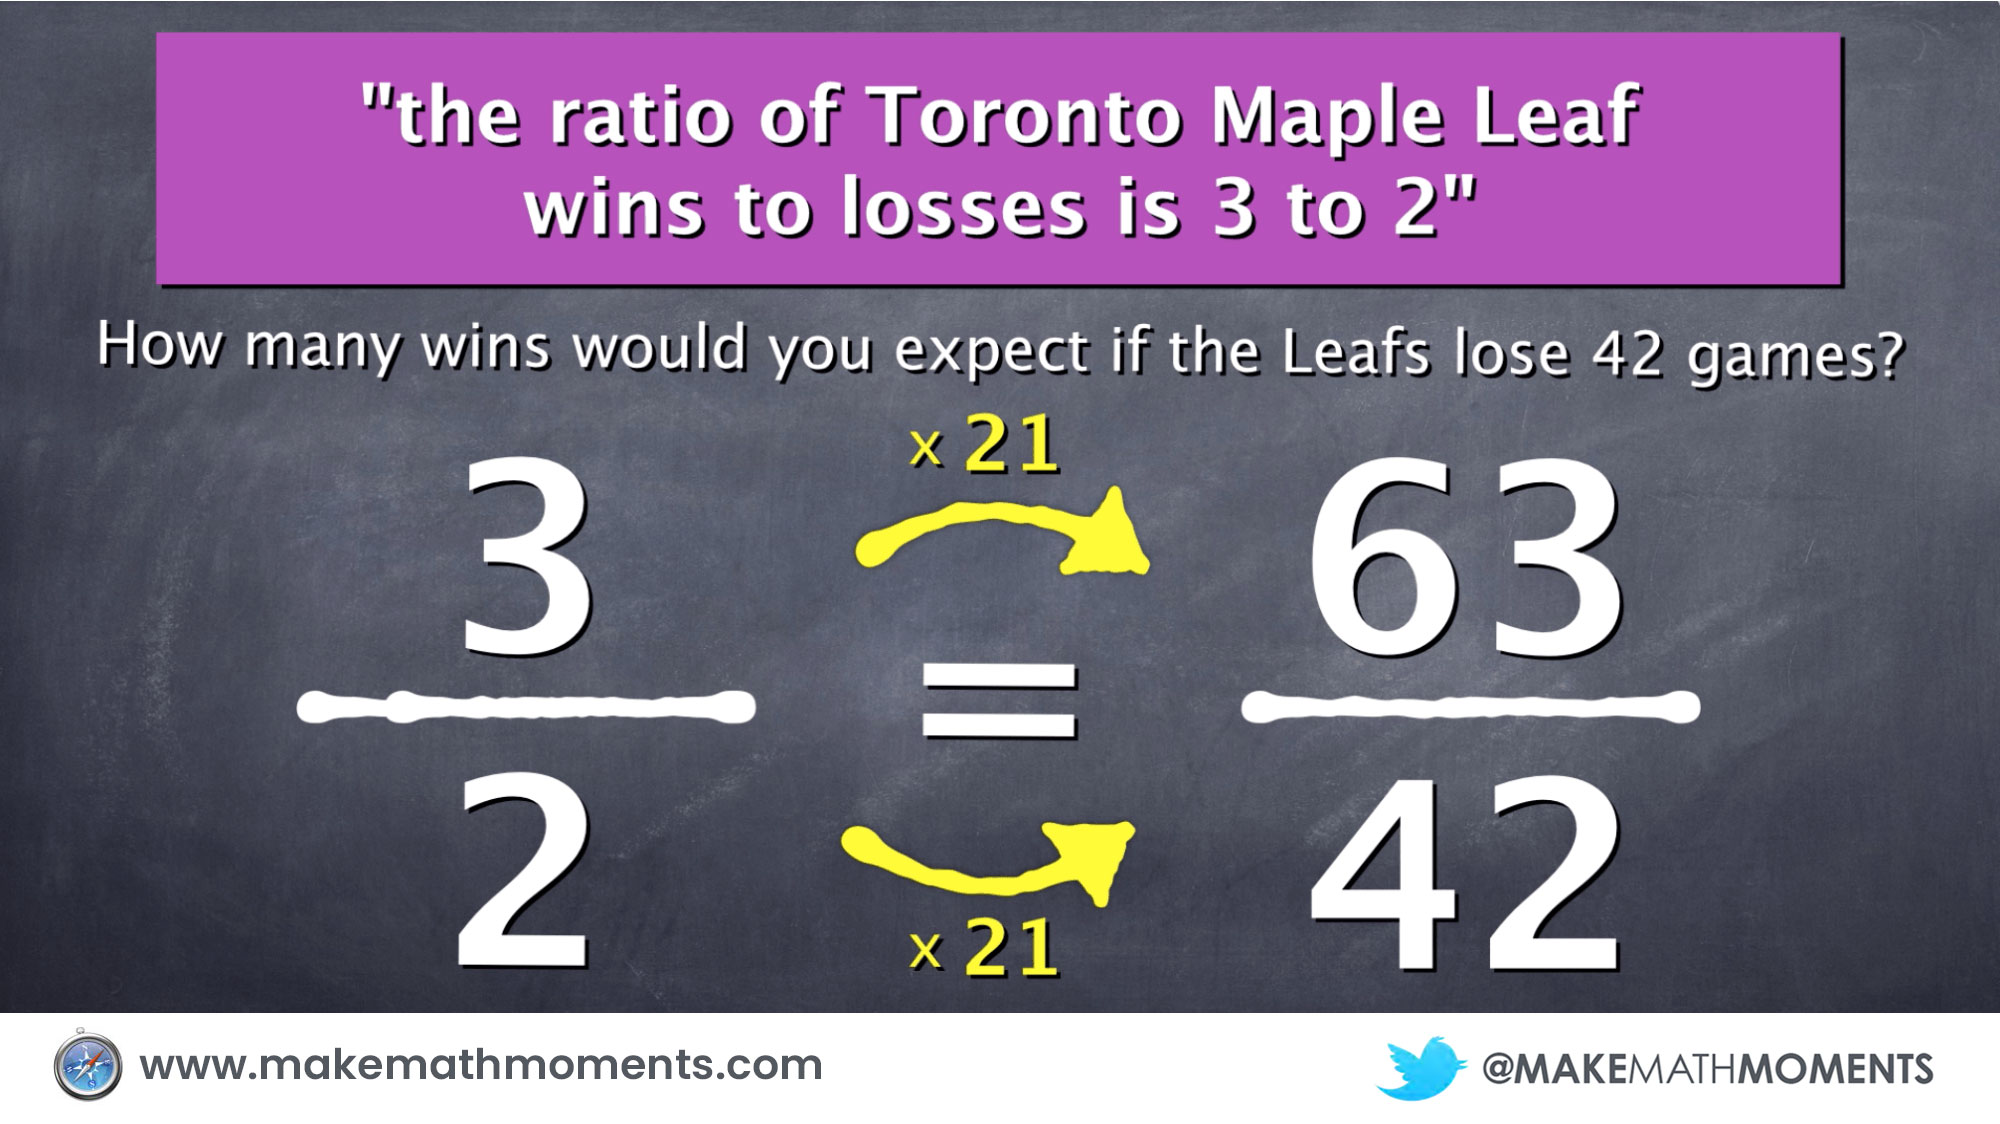

I love the visuals, and the sports example is very engaging for students! I do wish that you had some visuals that used tape diagrams to solve the problems. The new math curriculum is encouraging teachers to move away from representing ratios as fractions because it confuses students, and instead we solve visually with tape diagrams. Thanks for putting this together, though!
Thanks for stopping by!
This video and visuals were created many years ago before I fully understood the complexity of ratios, rates and proportional relationships. We use tape diagrams / bar models / double number lines throughout all of our proportional relationship units. Be sure to check them out here: https://learn.makemathmoments.com/tasks