Episode #335: Storytelling with Data: Making Data and Numbers Come Alive in Math Class
LISTEN NOW HERE…
WATCH NOW…
What if we could transform how students—and even adults—view mathematics, turning graphs and data into a thrilling, creative superpower?
For many educators, engaging students in math feels like a struggle, especially when it comes to making abstract concepts like data and graphs relatable. In this episode, author Cole Nussbaumer-Knaflic shares how her passion for storytelling with data bridges the gap between abstract math and real-world understanding, inspiring both kids and educators to see math as a tool for discovery and empowerment.
- Learn how to use storytelling and graphing activities to spark curiosity and creativity in your students.
- Discover simple strategies to help students and teachers feel more confident with data, graphs, and problem-solving.
- Gain access to practical, classroom-ready tools and ideas designed to align with standards and foster deep, meaningful engagement with math.
Don’t miss this episode—hit play now and discover how to make math moments that inspire lifelong skills and confidence!
Attention District Math Leaders:
Not sure what matters most when designing math improvement plans? Take this assessment and get a free customized report: https://makemathmoments.com/grow/
Ready to design your math improvement plan with guidance, support and using structure? Learn how to follow our 4 stage process. https://growyourmathprogram.com
Looking to supplement your curriculum with problem based lessons and units? Make Math Moments Problem Based Lessons & Units
Be Our Next Podcast Guest!
Join as an Interview Guest or on a Mentoring Moment Call
Apply to be a Featured Interview Guest
Book a Mentoring Moment Coaching Call
Are You an Official Math Moment Maker?
FULL TRANSCRIPT
Jon Orr: Hey there, Cole, welcome to the Making Math Moments That Matter podcast. We’re excited to speak with you today, because we’re excited to share your session in the upcoming virtual summit. At the time of this recording, we haven’t had the summit yet, but I think when everyone hears this, it’ll be after the summit, and they’ll be maybe wishing that they were in the summit and trying to dive in to get access to that replay, which is still there. So, hey. How you been? Let everybody know where you’re coming from and what you’ve been up to in your world these days.
Cole: Sure thing. Well, first, thanks for having me, John. I’m excited to be here and excited for next week’s session. So my name is Cole, and I run a company called Storytelling with Data, where we spend most of our time working with business people, helping them communicate effectively with numbers and graphs in a business setting. But the thing I’m more excited to share and the topic of the session that I will be doing next week
is aimed at a different audience, a younger audience, with my new book, which is called Daphne Draws Data, a storytelling with data adventure. I’ll just show it up here for those who are looking at the video. And this book features a lovable dragon named Daphne who has a unique talent for drawing and drawing something in particular, which is data. So she likes
Jon Orr: There it is, if you’re watching on YouTube.
Cole: collecting information and turning it into pictures as a way to help others and make friends. And so she goes on an adventure where she’s able to do this in a number of locations, in the jungle, underwater. Those who watch my session will be able to get a taste of that. And it’s really meant to inspire kids and
change what is often the narrative around math, or at least the narrative that I’ve experienced through my own kids, into something that is a superpower. Not something to be feared that’s complicated or boring, but really making numbers relatable to kids and questions that they may have about themselves or about the world around them. So the book, the story is just that. It’s a story.
Data that Daphne draws is very pictorial. There’s not even a mention of the word graph. But then that is accompanied by a graph glossary that gets more into the details from a learning standpoint and goes through each of the types of graphs that Daphne draws in her adventures, bar charts, line graphs, pie charts, and scatter plots. And then we’ve been actively building out a lot of resources, mainly aimed at educators to help. bring these lessons and hands-on activities to instructors.
Jon Orr: Awesome, awesome. know, I think the message is an important message and a message that all the listeners I think of our podcast would be, you know, leaning in towards and agreeing with as saying like these, these ideas around mathematics, you know, have to change it. How do we, how do we do that? Which I think kind of leads into like where, you know, our memories of math and our experience of math. And when I talk about the, the, the regular listeners are waiting for your math moment, which is like,
You know, the only question we ask every single guest and when we say math class, there’s like a moment that pops in your mind, a moment that sticks with you all these years. When we say math class, Cole, like what is popping in your mind right now that you’ve carried with you all this time as, and it’s probably shaped the way you’ve viewed it before, but also maybe, you know, shape how you view it now.
Cole: Absolutely. It’s interesting because the first moment that popped into my head was one where I was initially like, Ooh, maybe I don’t share that. But then you encouraged me to, which I think is probably the right call because I always, I loved math. I loved math all through school. And then I got, for me, was the moment that comes in my head. was my first year in university and it was the math class there, which was very different from one that I’d encountered before. One, it was massive. I went to a large school. So like,
hundreds of people in this class. And I got to the first test and I completely blanked. And that had never happened to me up until that point. And that stuck with me. And it wasn’t because I wasn’t prepared. I honestly don’t even know looking back what went into it. I was able to recover in terms of.
following up with the professor and like managing to get through the class and go on to major in applied math. So it didn’t stunt anything career wise. But it does make me think about all of the, and I’m sure you have a big repertoire of this that you’ve heard of from guests on the podcast, but all of the moments that happen that kill math over the course of someone’s education or that turn it off.
for them because I also remember then going on to major in math and I would be one of usually was one of two women in my smaller classes once I got to the higher level courses. And so.
I want to figure out how we can turn that around and how we can have such a strong confidence and capability that we build in young kids so that it doesn’t, so that a moment of frustration or a moment of maybe a misguided teacher saying the wrong thing doesn’t turn off kids from math because it’s a skill as we know.
that everyone can use and that people can draw on in so many different ways. Because when I look back, for me, I do use math in my career, but I think more than the math that I use, it’s the problem solving ability. It’s the analytical thinking. It’s being able to go into something and might be ambiguous, but break it into the component pieces and answer those questions and put it all back together in a way that works. And these are absolutely lessons that we can be teaching. kids a lot younger than we typically do.
Jon Orr: Sure. And where did you like, like, like for me, think like my moment was a lot earlier than that. Like my moment was like fourth grade, but I don’t think I capitalize on like the why behind it until much later, probably as I was a teacher. But my, my fourth grade was like, felt like amazing because I was getting these like super puffy stickers for being a master multiplier. You know, I was just like cramming out multiplying at home, but I was really just like,
stacking the numbers carrying the one you know just doing that over and over and over again and then but then when like like you when it was push comes to shove it was like now I had to like actually apply that a little bit just like understand where like what I was really multiplying like I couldn’t do it like I had no idea and so then there was like this stuck with me was like I thought I was a master multiplier but that I actually wasn’t and then you know in a way that stuck with me because when I became a teacher it was like the you know where the wheels fall off happens in different spots for us on like
where we view our understanding of math, but also like the purpose of math, like you just described that you want students and kids to understand that math really is about problem solving, reasoning, using, you know, thinking. But was that something that you recognized early? Or like, is it related to that moment that you had where you’re like, you know what, I’m sitting down for this test right now. And I bomb it. And it was like, is it because maybe I was like,
surface level memorizer like I was like I was I was that almost my whole career like as a student and then and then realizing later it’s like actually there’s a lot deeper this going on like more nor deep thinking needs to happen here and I wasn’t doing some of that like where did this like focus on real problem solving come from because a lot of teachers realize that after we become teachers but I’m curious about your story there.
Cole: For me, think I didn’t have that eureka moment then. It’s looking back on things now and realizing that we could do this differently that would set people up, right? So that you wouldn’t have had the fail in the fourth grade. And I wouldn’t maybe have had it in university, though maybe there was some test anxiety there. not sure. So maybe I still would have. But I think for me, it was really just seeing for myself and how the math foundation that I have
plays out in terms of the skills that I have and how I’m able to navigate so many different situations and teach others how to do that. And that’s where I think there is such opportunity when it comes to teaching. Because what I’ve seen, what I remember experiencing, what your anecdote points to, and then what I’ve been seeing with my kids is when they’re learning math, it’s so abstract. It’s so disconnected from their day to day.
that there’s not this understanding or at least not a direct connection made where they get how useful it’s going to be. just right now, it feels like one of these things that they have to of slog their way through, try to figure out how to do the multiplication or the division, whereas, and that’s one of the reasons that I love graphs so much. One, there’s not a right or wrong answer per se. You can approach gathering data and
graphing it, drawing it creatively. And there’s actually a ton for kids to learn from each other. And I would say teachers to learn from kids and vice versa when it comes to watching how some of that plays out when we take something that we understand visually and put that on paper or move objects around to create physical graphs. But I think more than that is making it something that matters to kids.
Because if we can tap into something that’s important to them, a question they already have, now there’s no more abstraction from reality. Now we’re actually using numbers to answer the question that you have. And actually, they’ll point people to the session that I’m doing because I’m going to walk folks through in detail an activity that you can do in the classroom where you survey. Well, first, before you even survey the kids, you
ask the kids what they want to learn. And is the foundation of teaching them how to ask great questions. Because I think there are two things when you look particularly at like first, second, third graders, there are two things that they love doing and that they are really good at. Asking questions and drawing. If you’ve spent any amount of time with a second grader recently, it’s question after question after unfiltered questions, which I think is amazing.
because that is such a great foundation for analytical thinking. But we have to teach them how to hone their questions and how to get really good and prioritize which ones they want to answer, which ones they can answer. And so there’s a neat group activity you can do where you seed this through some discussion and brainstorming, and then break kids into groups and have them spend some time coming up with cool questions that they’re interested in.
It could be things that they want to learn about their classmates or their grade. It could be decisions where their collective input can have some weight. I’ve worked with schools lately where that’s been the case, where they’ve been able to ask things like, which of the following items do you want to see added to the hot lunch menu? Or it’s actually things that will impact them. And they can have a collective voice to be able to influence that. And so you can have kids.
brainstorm, come up with questions, help them prioritize them. And I realize I need to generalize so that I don’t totally cut off the content that I’ll be going over next week. But folks can tune in there for more details. And then you survey them, you aggregate that data, and you can help them graph it so that now the numbers that they’re working with are to answer their own questions that they’re interested in. They can see the direct application. And then you can
point out some of the ways that we added or we multiplied or we did these things in order to get there. And now this is the power. And that’s really what I want to instill is the confidence and the capability in kids that numbers are not magic. I hate it when numbers are portrayed as magic. Numbers are not magic. They are science. But they are extremely powerful. And when we can understand how to harness them,
how to visualize them, draw them as graphs. Now we’ve got this superpower that we are arming kids with where they can not only ask smart questions, which they already do, but now they feel empowered to gather data and answer those questions for themselves, help them learn more about how they might do things differently in their day to day, or help them understand more about the world around them.
Jon Orr: Mm-hmm. That’s great. It goes hand in hand with, I think, our main theme for the summit, this podcast. you I’m sure you sat in most of your school lessons where you weren’t asked, you know, what questions you had about the math. We weren’t provoking our students to, you know, have wonders first. And then because we basically we were telling them all the questions that they had to answer. But so they’re answering questions they didn’t even actually want to know the answers to. And and sparking curiosity is it is an important component of your of engaging students in math lessons, but really just empowering them to
own the mathematics that they’re going to be working on or learning. So I love that about the session that you’re going to be helping teachers with and giving them practical lessons that they can be using in their classroom. What do you say to a teacher who’s going to be in the session, who’s going to be learning, but then they just… And this is a common thing we know about some of the teachers who are listening, but also a lot of teachers who are listening right now are math coordinators, math coaches, and are helping teachers.
you know, strengthen their own practices in their classrooms. And what we’re you know, what they’re seeing or what we’re hearing is sometimes you see a teacher who just, you know, maybe just doesn’t feel as confident with the math, like we feel very confident with the mathematics and, and our understanding of it, because we’ve taken deep dives, either through our education or through our experience of unpacking, say, conceptual understanding of math, and we’ve gone down roads, but most educators don’t have time to kind of like,
venture down those paths because they’re teaching six other subjects, which means you’ve got an army of teachers who just don’t feel that comfortable with, you know, exploring math and giving that freedom up to allow kids to ask questions. So any advice, like it’s a, it’s a, a, it’s a big topic, a big, a big question, but any advice for teachers who are like, I’m just not that comfortable with mathematics when I go to, when I go to teach this particular, especially around graphs.
Cole: Absolutely. Yeah, so that’s one of the reasons that we’re working very hard to build out resources for educators and try to make it as easy as possible mapping Daphne Draw’s data and the lessons against Common Core standards, having discussion questions and answers for teachers to use, mocking up activities and putting together instructions that can be used in the classroom. Because I think that is one way, as you alluded to, teachers are busy. This is not their only
subject a lot of the times and so the easier we can make it for there to be plug and play sort of things which I think isn’t isn’t the only answer certainly I think the broader piece is helping build out the vocabulary and the confidence and capability for teachers and so we’re trying to do that as well and so on Daphne’s YouTube channel we’ve got
videos that are, funny, because when I originally started out, was thinking, kids, we should do entertaining videos for kids. I was like, well, yes, but, or yes and, helping teachers. And so that’s really where we’re shifting efforts now is making short videos for teachers that either are going to outline an activity or, in some cases, be videos that they can show directly in the classroom. And then we have discussion questions and activities that can go along with those. So it’s not.
Here we’re going to dump a book, this idea that you should be teaching your, having your kids graph data now is a new expectation. But here’s how we can make it easy for you, and how you might integrate this into other areas as well. so also mapping it across English common core standards. So you can kind of double up when it comes to a lesson plan, and really trying to make things easy. But I think in terms of getting teachers comfortable,
I’m hopeful that they’ll want to dive in as well because once you get going on this stuff, it’s fun. And you actually can let go of some of that control in a way that everyone benefits from because the kids get to use their creativity. get the surprising things that kids are interested in and want to learn about can take you in some really interesting directions. So I’m hopeful that teachers will embrace that.
Jon Orr: Love it. Love it. Now storytelling with data, you said is aimed at specifically helping businesses, used, you know, maybe use data and what presentations and, and, and, and, and, And so what are you seeing? Like, like obviously that you felt like that was a need that people are lacking or a skill that, that adults in business owners are lacking in terms of like, how do I read data? How do I use data to make points or how do I use data?
Cole: Yeah, anyone who’s communicating with data.
Jon Orr: you know, tell my story of like what I, what I, what I need to tell here. So walk us through like the connection here that you’re, you were seeing and say the business world and, the say maybe this, this need or this lack of skill that, adults were having and then how it’s tied to like what’s happening in classrooms. Like what are some of these like important communication skills that we maybe haven’t?
passed on as a teacher to students so that when they get to the business world or they’re in the real world that they have say these general graph building, graph reading, graph storytelling skills.
Cole: Yep. Well, and I think I would say just tying this back to your previous topic on teachers is just that in the business world, we have this as well, where there are people who are working with data and feel like they don’t want to be, or it scares them, because I think over the course of my career, it’s shifted tremendously where people in roles that historically didn’t have data or data wasn’t a big component of it.
everyone increasingly is being asked to do things with numbers and to make sense of information and we’ve got it all around us. And so for the adults who we teach, often, you know, though it’s grounded in data, it becomes lessons that are really around communicating effectively. So thinking about who you’re communicating to, making things work for them, considering where you want them to look in a graph or on a slide and doing something to make that clear.
right, using visual contrast, for example. Just make the thing you want people to look at colorful. Explain, tell them why they’re looking there. And really, because I think historically, if somebody looks at data or is encountering a graph, they’re like, I don’t understand it. The knee-jerk reaction is to say, I don’t understand it. I’m not good at numbers. It’s not my thing.
When really when a graph fails or when data communication doesn’t work, that’s exactly what it looks like. And that’s not a failure on the person looking at it. That’s a failure on the designer of the information. Because when we do this well, and Daphne does this well, when we do this well, you don’t even notice you’re looking at a graph. You’re just taking the information out of it and using it for your decision or your discussion.
And so I think it was combining that, so really understanding that the skill gap at the adult level are these really basic things. This is not rocket science. These are things that we can teach and that sound obvious when you say them, but until somebody says them, nobody really thinks about them. And they’re things we could teach much earlier, because one of the sentiments that we hear come up again and again with the adults that we work with is, why hasn’t anybody ever said this to me before? Why didn’t I learn this sooner? And so for me, it was that coupled with,
Having my own family, I have three kids who are 11, 10, and eight, and being so excited as they started reading and writing and developing the faculty of language and realizing we could be teaching the visual language of numbers and graphs so much younger than we typically do. And then to start seeing the graphs that they do come home with, right? They’re graphing like the different colored &Ms in a pack or the weather last month. These are not interesting things.
Either it’s lived experience and they don’t need a graph to show them what it was in the case of the weather, or like who cares how many green &Ms are in a pack, they all taste the same. And so how do you make it more meaningful, I think? And that’s where everything for me converged and what has turned into, Daphne draws data, but more than that has turned into this passion for trying to figure out how do we change this? How do we shift this? How do we get kids to want to learn math as much as they want to?
you know, play an instrument or run around in PE because they understand the benefit of it and what it can do for them in both the near term and the long
Jon Orr: Awesome. Now, if there was one big takeaway, one big idea you’d want teachers to take away from, say, your session at the summit, and if teachers are watching the replay later, like, what would you say is that one big message?
Cole: I think that graphs are fun and that they can be a really powerful tool for getting kids engaged, helping them be hands on and learn through that process.
Jon Orr: Awesome. Awesome. Okay. Thanks. Thanks, Cole. This has been a great conversation and I’m excited for the community to check out your session in the 2024 MakeMathMoments virtual summit. the sixth summit. It’s going to be happening and has happened on November 15th, 16th and 17th. You can also get access to the replays over at makemathmoments.com forward slash academy by joining the academy.
Cole, thanks so much for joining us here and sharing your insights with the Math Momo Maker community, and we look forward to catching up soon. Thanks.
Cole: Thanks, John.
Thanks For Listening
- Book a Math Mentoring Moment
- Apply to be a Featured Interview Guest
- Leave a note in the comment section below.
- Share this show on Twitter, or Facebook.
- Leave an honest review on iTunes. Your ratings and reviews really help and we read each one.
- Subscribe on iTunes, Google Play, and Spotify.
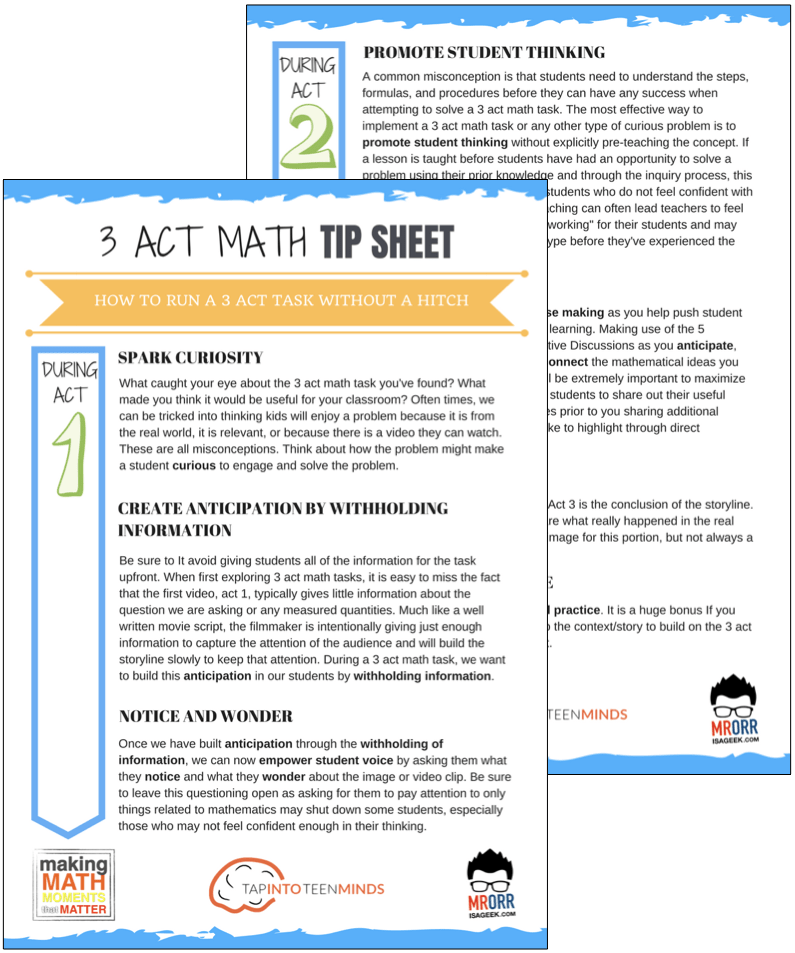
DOWNLOAD THE 3 ACT MATH TASK TIP SHEET SO THEY RUN WITHOUT A HITCH!
Download the 2-page printable 3 Act Math Tip Sheet to ensure that you have the best start to your journey using 3 Act math Tasks to spark curiosity and fuel sense making in your math classroom!
LESSONS TO MAKE MATH MOMENTS
Each lesson consists of:
Each Make Math Moments Problem Based Lesson consists of a Teacher Guide to lead you step-by-step through the planning process to ensure your lesson runs without a hitch!
Each Teacher Guide consists of:
- Intentionality of the lesson;
- A step-by-step walk through of each phase of the lesson;
- Visuals, animations, and videos unpacking big ideas, strategies, and models we intend to emerge during the lesson;
- Sample student approaches to assist in anticipating what your students might do;
- Resources and downloads including Keynote, Powerpoint, Media Files, and Teacher Guide printable PDF; and,
- Much more!
Each Make Math Moments Problem Based Lesson begins with a story, visual, video, or other method to Spark Curiosity through context.
Students will often Notice and Wonder before making an estimate to draw them in and invest in the problem.
After student voice has been heard and acknowledged, we will set students off on a Productive Struggle via a prompt related to the Spark context.
These prompts are given each lesson with the following conditions:
- No calculators are to be used; and,
- Students are to focus on how they can convince their math community that their solution is valid.
Students are left to engage in a productive struggle as the facilitator circulates to observe and engage in conversation as a means of assessing formatively.
The facilitator is instructed through the Teacher Guide on what specific strategies and models could be used to make connections and consolidate the learning from the lesson.
Often times, animations and walk through videos are provided in the Teacher Guide to assist with planning and delivering the consolidation.
A review image, video, or animation is provided as a conclusion to the task from the lesson.
While this might feel like a natural ending to the context students have been exploring, it is just the beginning as we look to leverage this context via extensions and additional lessons to dig deeper.
At the end of each lesson, consolidation prompts and/or extensions are crafted for students to purposefully practice and demonstrate their current understanding.
Facilitators are encouraged to collect these consolidation prompts as a means to engage in the assessment process and inform next moves for instruction.
In multi-day units of study, Math Talks are crafted to help build on the thinking from the previous day and build towards the next step in the developmental progression of the concept(s) we are exploring.
Each Math Talk is constructed as a string of related problems that build with intentionality to emerge specific big ideas, strategies, and mathematical models.
Make Math Moments Problem Based Lessons and Day 1 Teacher Guides are openly available for you to leverage and use with your students without becoming a Make Math Moments Academy Member.
Use our OPEN ACCESS multi-day problem based units!
Make Math Moments Problem Based Lessons and Day 1 Teacher Guides are openly available for you to leverage and use with your students without becoming a Make Math Moments Academy Member.
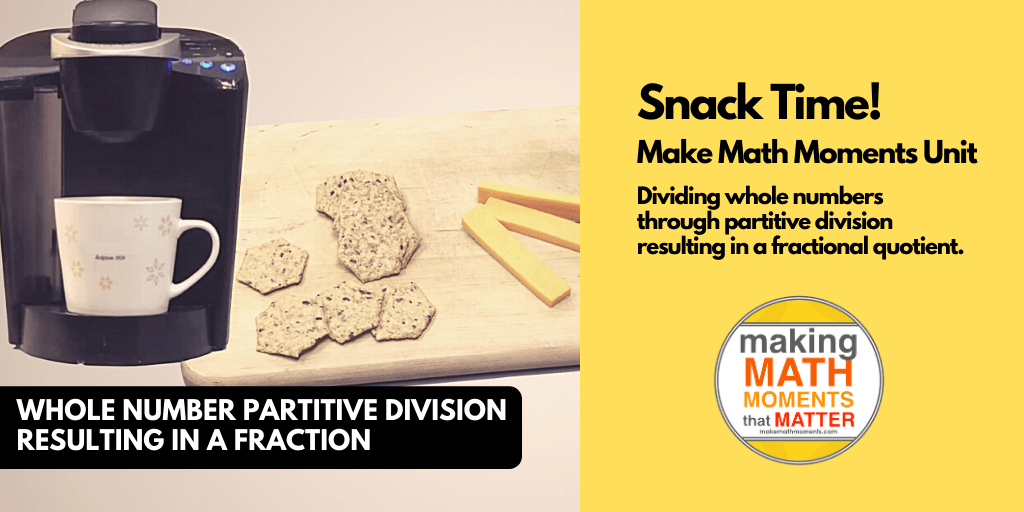
Partitive Division Resulting in a Fraction
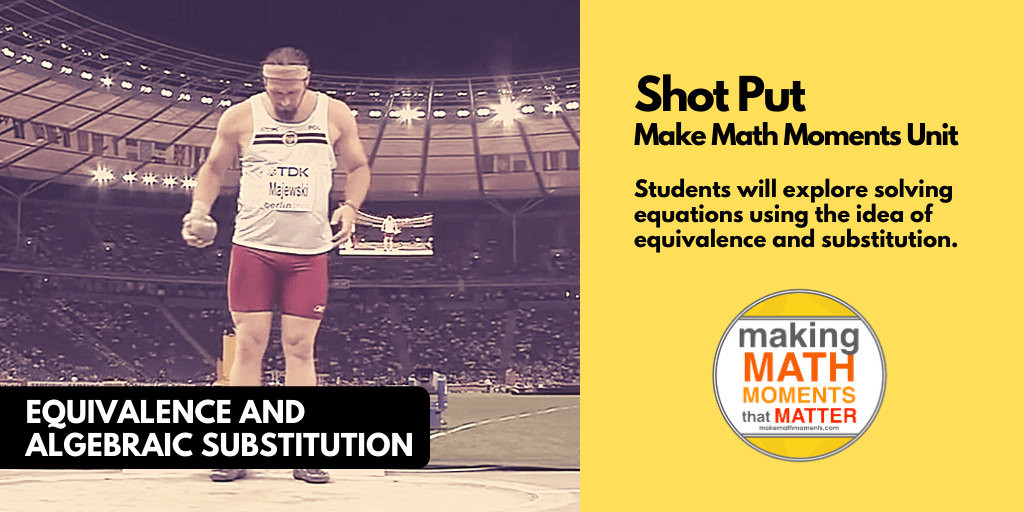
Equivalence and Algebraic Substitution
Represent Categorical Data & Explore Mean
Downloadable resources including blackline masters, handouts, printable Tips Sheets, slide shows, and media files do require a Make Math Moments Academy Membership.
ONLINE WORKSHOP REGISTRATION
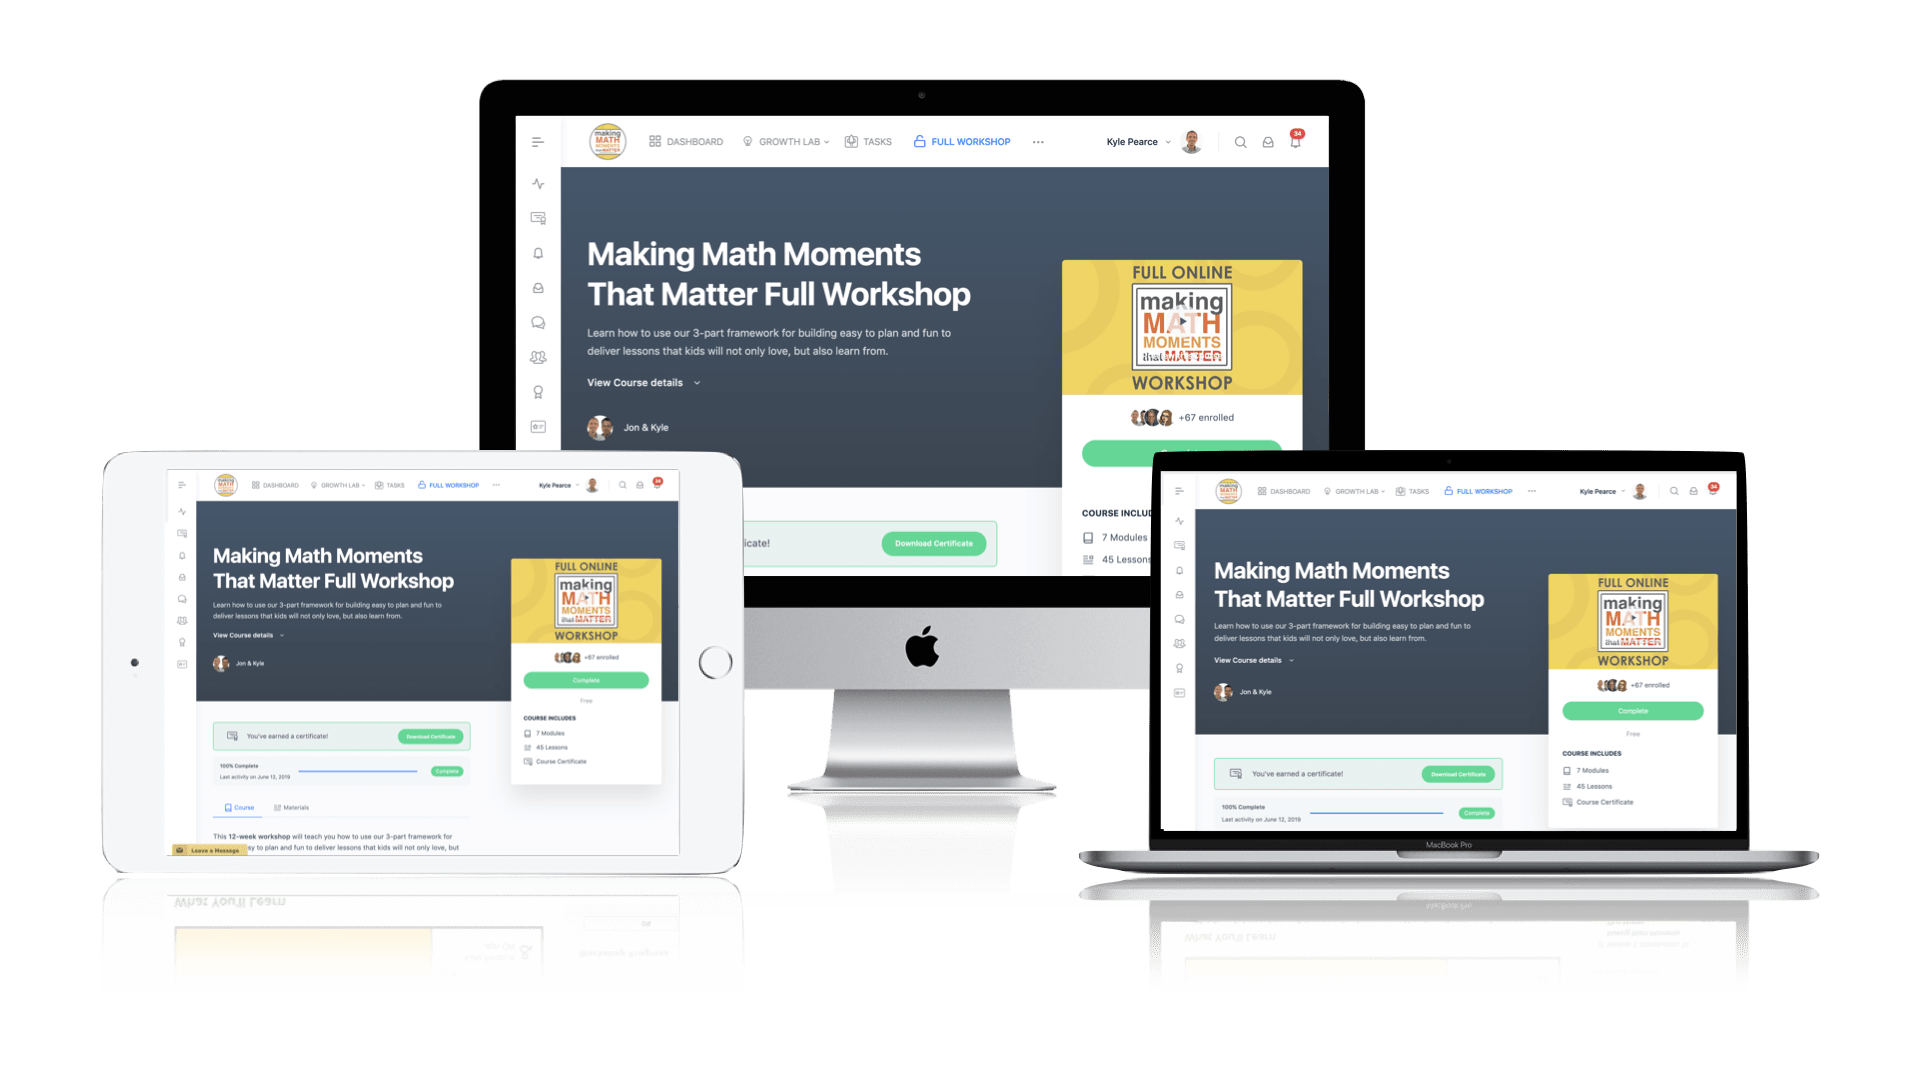
Pedagogically aligned for teachers of K through Grade 12 with content specific examples from Grades 3 through Grade 10.
In our self-paced, 12-week Online Workshop, you'll learn how to craft new and transform your current lessons to Spark Curiosity, Fuel Sense Making, and Ignite Your Teacher Moves to promote resilient problem solvers.



0 Comments