Episode #374: Your School or District Math Improvement Plan Dashboard: A Walkthrough Guide
LISTEN NOW HERE…
WATCH NOW…
How do you know if your district’s math improvement plan is truly making an impact—and can you prove it before the test scores roll in?
If you’re a district math leader overwhelmed by fragmented documents, unclear goals, and scattered PD efforts, this episode will feel like a reset button. Too often, school systems lack a cohesive strategy for driving measurable, sustainable math gains. This walkthrough episode introduces a powerful dashboard tool designed to align your vision, track real progress, and ensure your team’s efforts are coordinated across all levels—from PD sessions to classroom walkthroughs.
Listen in to discover:
- A proven framework for setting clear, ambitious math improvement objectives—and the key results that actually move the needle.
- How to avoid common planning pitfalls by narrowing your focus for deeper, lasting impact in teacher practice and student learning.
- A ready-to-use dashboard tool that brings clarity and coordination to your entire math improvement process, complete with action tracking, evidence collection, and progress monitoring.
Press play now to start building a math improvement plan you can track, measure, and celebrate by year’s end.
K-12 Math Coordinators
Your School or District Math Improvement Plan Dashboard
Math Goals Without a System = Wasted Time
Most districts set lofty goals. Few have a system to track progress or measure real growth. That’s where everything falls apart. Our Math Improvement Plan Dashboard brings structure to your strategy—so your vision becomes results.
Ready to Align Your Math Goals, PD, and Evidence?
Our dashboard is more than a spreadsheet—it’s a full planning and monitoring system to help you organize objectives, set clear key results, and track progress across PLCs, coaching, and PD. If you’re looking for clarity and traction, this is your tool.
Attention District Math Leaders:
Download a free copy of your Math Improvement Plan Dashboard Here on this page.
Not sure what matters most when designing math improvement plans? Take this assessment and get a free customized report: https://makemathmoments.com/grow/
Ready to design your math improvement plan with guidance, support and using structure? Learn how to follow our 4 stage process. https://growyourmathprogram.com
Looking to supplement your curriculum with problem based lessons and units? Make Math Moments Problem Based Lessons & Units
Be Our Next Podcast Guest!
Join as an Interview Guest or on a Mentoring Moment Call
Apply to be a Featured Interview Guest
Book a Mentoring Moment Coaching Call
Are You an Official Math Moment Maker?
FULL TRANSCRIPT
Welcome to your math improvement planning dashboard. This is a dashboard tool that we use with all of our district partners who are in our support programs for planning and supporting math improvement plans, sustainable math improvement plans, aligned math improvement plans. It’s a tool that brings all the pieces together. So if we zoom out for moment, before we get into details, because this is what this video is going to be about. It’s a walkthrough specifically of how to use this tool, how to set up.
the components that you need to make sure that you are on the pathway for success, which is really making sure that you’re a tool to organize how to answer this question. When I get to the end of the year, when I get to the end of the school year, and when I look back on the improvements that I tried to make in terms of math improvement, math PD, what was the impact that we created this year and how do I know? That question needs to be answered. It needs to be answered by every math leader across the world.
in terms of say K to 12 math instruction. Like we have to be able to answer that question. If we can’t answer that question definitively, then we have to say, well, what were we doing if we weren’t saying making sure that we were gathering evidence to see if the things that we were working on were making actual improvements that we can actually measure and not wait for say standardized test results to tell us whether they had, those are long-term trend goals, those are long-term things we’re gonna look at. But what are we doing specifically that moves the needle?
towards effective math instruction and effective math experiences for our students. Oftentimes we can’t say definitively what were the things, but then if you can’t say these things had an impact, then how do we know we’re working on the right things? And how do we know that we’re not, say, or needing to tweak and strengthen those right things? We have to look for those appropriate measures. And that’s what this dashboard tool does. It builds on the process that you need to strive for math improvement and structure your math improvement planning process around.
That’s what we teach here at Make Math Moments, which is our math improvement planning process. So before we kind of dig into the sheet itself, one of our coaches, Yvette Lehman, is going to dig into this sheet and how to use this sheet. And somewhere around this video, you can download a copy of this sheet. It is for you. You can definitely use it to make improvements across your district and structure and coordinate the efforts for professional development across all the layers that exist.
That’s what we teach, as I said, here at Make Math Moments. But to zoom out, it’s important to say know where we’re trying to go and zoom out, why we’ve coordinated this sheet to do what it does. Because we believe strongly there are four key areas to strengthen and optimize for in math improvement planning at the district level or at the school level. It’s a fractal process. So these four areas are making sure that we have a clear vision, a clear vision that’s defined. We have the
the objectives in place, we have the key results that we wanna measure throughout the year. We’ve optimized and sustained our PD structures, our PD coordinated, our PD plans and the structures we have available. We’re focusing on the mathematics that builds capacity because that’s the gatekeeper to making sure that teachers can be flexible in the classroom. And then we’re inspiring growth, which means we’re creating the next round of leaders to keep this going. And then every year it gets easier and easier this cycle. That’s what we believe here at Make Math Moments in our…
And what we teach here is really this, I’m zooming very far out, but inside this system of these four stages, we’re teaching you how to build those and sustain those math improvement plans. And that dashboard that we’re gonna be walking you through specifically lives across all four stages. It’s the glue in the organizational tool that can bring.
everything that you’re doing into the same place so that you’re not juggling different pieces. You’re not looking here and looking here and looking here and living in a sea of different documents. You’ve got a nice well-organized dashboard to monitor all the moving pieces of your PLCs, of your big scale pullout sessions that happen throughout the year. You’re in one-on-one coaching sessions. You’re managing TOSAs or math coaches. You’re coordinating MTSS. You’re coordinating…
know, curriculum adoption program, all of these pieces need to be coordinated across a system. And that’s actually what this book here, Systems for Instructional Improvement teach, which is a math improvement plan or an improvement plan for professional development needs to be coordinated across all levels. And if we’re not, say, setting up our systems to coordinate that, then we’re not maximizing the impact that we can have. And that’s what the tool does. So the tool is going to walk you through that.
This is our big picture, this is our map of how do we design and measure appropriate goals? How do we optimize and sustain our professional development structures? are the optimal ways to do PLCs and coaching and how to coordinate all three of those? What are the things that help us define the action items that actually make a difference and how do we make sure that they are coordinated across all three levels?
How do we inspire that growth? What are we doing to build a capacity? what are the things that we should be focusing on? And how do we design our professional development to get results in terms of building our capacity for mathematics with our teachers that transfers into the classroom? These are the four things that we teach all year long in our Make Math Moments District Improvement Program. We partner with schools, we partner with school districts to make sure and install this system in their systems.
That’s what we do on a regular basis is build this. So we’re giving you our tool. We want you to kind of peek at it. We want you to kind of use it. want because we’re concerned with making sure that as many districts across the world can sustain themselves in terms of math professional development and math improvement. We believe this tool is a really helpful tool to kind of coordinate all of those efforts. So stick around. Keep watching. Lehman, one of our coaches, is going to dive into how to use this, how to
how to bring all the pieces together, like your objectives and your key results and the vision statement and your action items and the rationale. We use an if then how framework, how to make sure that the evidence is collected. We’re gonna talk about all that in this video. Here we go. So I wanna show you kind of like a high level preview. So some of you might be familiar with this tracking sheet. It’s a progress tracking sheet, but we’ve made some…
modifications to it over the last few weeks to kind of capture everything that we talk about when we’re in calls with our partners. So this is a high level overview. Typically, most of our districts have two to three objectives that they’re working on that are high level objectives and we always say right those objectives shouldn’t they should be lofty and ambitious because they’re not changing year to year. They’re gonna hold true
for three to five years so that we don’t have the every single year it feels like we’re starting over again. We want that flywheel effect. We want the momentum to continue. We want to build sustainability. So your lofty objectives, we typically recommend no more than three. Two sounds good also, you know. So that’s where you would identify. I need to, I don’t know why I keep not changing this to objective, but.
you have your three objectives. So in this sample, I just wrote three objectives. So this one’s around discourse because that reflects the work that many people are doing. This one’s around problem solving using a variety of strategies and models. So connecting representations. And this one’s around fluency. And they’re just sample objectives. But I’m going to dive into this middle one here because I think it’s the one that’s the most thought through.
So imagine that your objective is around problem solving. And what you want to see happening consistently is you walk into a classroom and students are engaged in meaningful problem solving and they’re doing the thinking. So they’re not just being funneled to a single procedure and, you know, having no idea why they’re even using that procedure, but that’s what was introduced yesterday. They’re using a variety of strategies and models.
that they are leveraging to make sense of problems and find solutions. And we want them making connections between visual and abstract representations. So if that is your objective, we can all agree, I think that’s a five-year objective, to see that happening consistently in all classrooms while students are engaged in problem solving. The next piece of the puzzle that we’ve been kind of fine tuning is, well, how are you going to keep up
pulse on that change in the long term. So what is happening currently in your school or district? So do we have a good kind of pulse on what is currently happening in our district when students engage in problem solving? Can we articulate the current student behaviors? What does it look like, sound like, feel like when students are solving problems in their classroom?
Once we have that baseline, we need to be able to notice and name change happening over time. And so what we’re suggesting is, you have some type of structure or tool that helps you capture that change over the long term? And so the one that I suggest in the sample is like a walkthrough protocol with a standardized observation tool, where we’re all talking about what we’re noticing in naming and we’re looking for evidence of this shift in student behavior.
And we’re analyzing where you would look at like frequency of a variety of strategies and models and graph the frequency over time. And maybe this walkthrough makes sense to do every single year, but maybe it actually is like every 18 months or in two years, because in six months or nine months, you’re like, I don’t think we’re going to see a lot of change. It’s not a good use of our time right now. But in 18 months, I want to take another pulse on the system. I need to know that we’re working toward our objective.
And we want to have all stakeholders involved in this process and understand what the tool is for and how it’s helping us get closer to our vision for mathematics teaching and learning in our district. So you have your objective and you have your long-term way of monitoring growth towards that objective. So these two are kind of big picture. And how is that? I think, you know,
You kind of were saying you’re wrapping your mind around like this process. And I think a lot of us still, still kind of are trying to also go like, how does this play out? does this look like for me? what, what was that kind of like shift that you felt like you were making? Okay. So my thing that what I was struggling with is that sometimes I was describing this monitoring tool, like this
evidence of change that’s more broad and has a larger scope, I was calling that a key result. But that is not a key result. And I’m going to talk about why it’s not a key result. So this like lofty documentation of ambitious change over time and observable behavior over time isn’t specific enough, time bound enough, actionable enough to be a key result.
And so that was where I had, I was confused in this process and I’ve gained a bit of clarity over the last few weeks. Right. Yeah. No. I know, and I was sharing this with Michael and Morgan who are here on the call and, I, and I know that the key result process has been kind of like, how do we, how do we do this? Right. How do we feel like this better? I don’t know if Michael and Morgan, you guys want to like, remember on our calls last week, I think it was last week, you were like, I think I feel, I think, I think that makes it more clear about.
how to think about my objectives and key results in terms of say the measurements and not always having to say like, I need to take these measurements throughout the year when we might not see exactly the change that we might want to see on that thing, then get more specific with short-term measurable goals. I don’t know. You guys, I don’t know if you guys want to, you’d feel for, you don’t have to, I was just, I’m putting you on the spot for sure.
Yeah, I think that we were struggling with having those big goals and feeling like we needed to measure them every quarter when we knew that we weren’t really making that much progress. And so now that we’ve kind of looked at this with John, I think it seems more doable and like we can actually make steps towards things. And so I think it’ll work out better.
Some of you have, you know, an observation tool that you’re using through your walkthrough process. Some of you have teacher surveys, for example, and the thing is like, you’re not going to see a drastic change in efficacy on a teacher survey in a few months. Like what you’re looking for is trend data over time and same with you. Like I would say maybe if you were like working with a teacher repeatedly over those months, you would
But you’re surveying the entire, you know, all teachers in the system, let’s say. Or if you’re using student assessment data, like you know that that’s trending data as well. So it’s like, and it’s, it’s lagging. So it’s like, we can use that as a long-term measure of change over time, but it’s not really helpful for monitoring the work we’re doing right now. Like the steps we’re taking immediately. So that’s where our key results come in, which I have two key results for this solve.
problem-solving goal or objective. So the key result should really be the result you want to get in the short term. It’s a milestone you want to hit on your road to meeting that objective down the road. So it’s something you’re going to commit to and you’re going to monitor in the next three, six, nine months. It’s a short-term
Like something that you can actually say by the end of the year, yes, we achieved what we set out to do this year. So here’s an example. So imagine you’re working on connecting representations and increasing the use of efficient strategies for your students. A key objective might be that by May 2025,
80 % of case two students will show an increase in the average number of accurate models and strategies used when solving subtraction problems as measured by a pre-post assessment. So why is that a key result? Because it’s narrow. Like we’re talking about a defined grade band. We’re talking about a single operation that we want to strengthen, which we know will require us building teacher capacity. And we’re going to closely monitor
A sampling of students within that grade band with a pre post assessment to see when I give them, you know, three different subtraction structures in September and they solve it and then I give them the same three subtraction structures in May and they solve it. Are we seeing an increase in the variety of representations and strategies that our students are using? That is a key result. Another example of a key result. doesn’t always have to be
student data driven a key result, it’s just something you’re trying to accomplish. So another key result is like 80 % of grade four to six teachers will implement a problem string once a week. Like that’s something that you’re saying we’re committing to this year that needs to become a norm within our district. And then we’re going to monitor that using coaching logs and teacher daybooks.
So your key results should be very specific, very narrow, very achievable. Yvette, what do you say to like, when you think about it like that? Cause I think a lot of us are probably, our minds are going like, does that mean I need to write a key result for every grade or every say, you know, elementary and high school and maybe grades one to three and then three to, you know, like, like how many key results am I actually going to?
to write and then and then how many results am I going to create measurement tool like even so when you say it like that right now it feels like that’s a lot so what do you say when you’re like do I do a lot or do I do a little and is it okay that I do a little even though it might be a lot so for us I think it’s about feasibility right like if you can do it if you can commit to four
key results and you actually have the capacity and time and resources to achieve those four, that’s amazing. But if you don’t, if you can’t commit to them, then I would rather have two key results that we actually hit rather than four key results that we partially achieve.
Like it’s like, we want to get to the end of the year and actually truly be able to say, have adopted this practice. We’ve made this improvement. We’ve seen this change. Exactly. Like I think, and then we’ve, we’ve been sharing this idea a lot lately this year is, is that I think we, we write key results where we write that I want that to happen, which we all do want say this outcome to happen by the end of the year, which is try to move as many teachers as we can. and so we, so we,
set these lofty goals. Like I want to move 80 % of all my teachers or I want 50 % of my teachers. Like, but without actually trying to go, what is the logistics to move that many teachers on say that continuum or hit those goals that we set for ourselves? Because it’s because we know the reality of going, if I’m going to see shifts in teacher practice that are consistent, teachers need need say,
consistent coordinated effort across large scale pullouts, PLC time, individual coaching and repeated touch points. So that at least those teachers are getting the feedback they need, which tells you right then, like coordinating that around one key result can go, I don’t have any more capacity to do another one. You know, when you think about what, what it actually takes to help a teacher move their practice from here to there.
And if we’re really dedicated to doing that, we would commit to less teacher impact, like less teacher folk, like less teachers to focus on. knowing that we will create that impact for though that small subgroup of teachers and then go, we’re not actually. impact for all teachers because we know we can’t do it. can, we can set up opportunities for teachers to engage in professional development. Sure. Which is like that large scale up here level.
but those, but the likelihood of the, the consistent change that we want to see as part of our key result, these people probably as a whole won’t be there, but those people are included in that large objective where over time we’re hoping to move that needle, which is that a measure of the objective, which that was talking about earlier. And that’s where we can see some of that long-term trend growth because we’re continually targeting.
small key results that are all tied to that objective. Cause I think we need to, when we’re planning this for next year, we, think we, what we want to do is we want to go more narrow so that we can say, check off. Yes, we see impact and we’ve got the evidence that says we had impact. which is, which is saying I might only write one key result and then fully map it out to see what does it look like from my time commitment?
in terms of all three of those components in professional development structures, so that I actually achieve that key result. And you might realize that you can’t do another one, or you can say, I’m going to focus 100 % of my time and effort to hitting that, but I won’t know when I hit it. So I’m going to not write another key result until I know I’ve hit it. And when I’ve hit it, then we can work on say another key result mid year.
I don’t know, thoughts, questions? we’ve been talking a lot and I know Kyle just showed up too, so give a wave, Kyle. So what you’re saying, John, is I shouldn’t start talking because it sounds like it’s been a lot of us talking and not so much from the group yet. We’ve been preaching. We’ve been preaching. anybody want to add a comment or a question or a wonder? Yvette’s also not fully…
mapping this out yet for you. So we still got a little bit more to walk you through here. I’d love to get some people’s first blush thinking behind what we’re sharing. And one thing I will say, having come into the meeting a little late here is you can easily be overwhelmed by looking at this on the screen and seeing a lot of text and a lot of things going on, but keeping in mind that this is something that we craft as we go through the process slowly, but surely.
Really, I think the goal here is about trying to stay as reasonable and realistic, I think, as possible so that we can stay on track to make real gains in those key areas that we’re after. And one of the things I don’t think we’ve said yet, right, Yvette, is that we’re going to help build this with you on those calls. So when we’re on a call with you, we’re going to pull this up and we’re going to like say, how do we, like, where can we fill some of these gaps in that we’re seeing, you know,
so that we make sure that we have some of this and we’ll do this on the call with you and then moderate throughout the year with you anyway. So we’ll stop talking now. So you have a chance.
Uh, I, this is that awkward time where we wait, but, uh, I’m going to, I’m going to tap Beth on the, on the shoulder here for a sec. Cause I know Beth being a consultant, um, and working with teachers, like, what are your thoughts, Beth, on the go narrow working with teachers and, committing to like, how much, like even, even in like, think of your experience, like how much time and ex in touch points with teachers are you seeing that it takes to move the needle? You know, like help, help see that.
transition that’s consistent, like it’s more than probably what we think, right? Yeah. absolutely. Absolutely. In fact, that’s something that I’ve noticed in my own practice and supporting teachers is that if I go too broad, then nothing gets accomplished. You know, I’ll have maybe one or two teachers from a school that I work with.
who are super excited about it and they will grasp onto it and everyone else will just kind of be like, okay, every year we sit in these professional development sessions and we learn these new big lofty things that we’re supposed to be doing. And so they just kind of close their door and keep doing what they’ve always done. I will say that I recently had an administrator voice concern and I’m curious what you all would say to them that said that
Well, if we focus on things that are too narrow, then all the other stuff that we’ve been focusing on, they’ll stop working on that. So it’s like, if we start focusing on this piece, all the stuff, the fact fluency stuff that we’ve been focusing on leading up to this, they’re not gonna pay attention to that anymore. So I’m just kinda curious. I know what my answer was, but I’m curious what your answer would be. A thought that crosses my mind right away is I would ask,
you know, do we have any evidence as to what they’re doing with those other things anyway? Right. So again, and I think the messaging part is certainly a concern. We, we definitely don’t want the messaging to be anything other than this narrow focus matters because that’s not net. That’s not what we want here. And I think that’s one of the reasons why we do stay too broad because we’re like, we like that.
and we like this and we like this too and we like that as well. But the real question would be is how much progress have we made on any or all of those areas? And is that worth the, you know, we’ll say the sacrifice. So if there’s not really any movement or very, very little movement, is that worth it? Or is it worth going really deep?
really far with one of those things for now so that we can get closer to building up some of the others. Yvette, I saw you were excited to share too. I think this is a problem and I’ll share an example in my own district. We made a shift around the science of reading towards a phonics-based approach to literacy instruction in K2 and we focused a lot on phonics because that was the piece that was missing. We now have a hundred minutes of phonics only in our district.
because we focused, it’s like teachers abandoned all of the other good things they were doing in comprehension to prioritize phonics because that’s what they’ve been hearing for the past two years is the priority. So that is absolutely a legitimate concern. One thing that we did in math, Kyle and I actually in our district to alleviate some of that concern is that we
we had what we called our flexible math block. was what were the components of a comprehensive math program. And in every single touch point, we would zoom out, then we’d zoom in, then we’d zoom out, and then we’d zoom in. And we would really try to help teachers understand where this lives within their comprehensive math program and being very explicit that this is one piece of it, and this is where this piece lives. This is where this, you know, because we always had to remember
the big picture and I think maybe in literacy, although we tried to do that, we weren’t super clear when we rolled out the phonics instruction what the other part looks like. And so we didn’t focus on it. We weren’t super clear around how to support comprehension in K2. And so we had a huge pendulum swing and now we’re trying to correct it. So I think that’s a really, really valid point.
I think the zoom in zoom out part is, why say the having the objective and the key result, like the key result supports the objective. So when we say this is the objective, like that’s probably likely like, like the thing that you were talking about anyway, but like we were focusing on, on this idea, but then we’re going to get narrow here. Now, if the narrow part is completely disjointed of the broad part, then you can see that which one is which and should we go here? But if they’re connected and it’s like, this supports that.
Then you’re not saying we’re not focused on this. We’re actually focused on this. So everyone understands we’re focused on this, but this small subgroup or, or this target or, or what we’re going to do over here is, is more specific than say this. That’s the, and it’s like the thing we’re going to really focus our attention on for measuring and for really, you know, focusing the PD around, but without sort of shunning all of the other.
great things that are already going on or that we still want to be working towards as well. Sure. Kyle Morgan says share that link in the chat. Yeah, let’s see. Is it still up on the web? Let me see. Kyle will do that. Any other wonders questions? think know Yvette wants to share a little more.
Go for Yvette. All right, so after we’ve identified our key result, a process that you may find helpful or may not. So this template is for you. You can change columns, change rows, how you see fit. But basically, this is our if-then statement. And it’s kind of like our rationale for how this key result gets us closer to our objective. So if our objective is students connecting representations and using a variety of strategies for the purpose of problem solving through reasoning,
Okay, how does this key result around supporting subtraction strategies, models, and structures in K2 help us get closer to that goal? I think this is an important process to engage in, whether you include it on here or not is up to you, but really to understand the connection between your key result and the outcome you’re hoping for long term. And so an example I’ll give to you is Gwen in New Jersey.
She is supporting the implementation of Math Fact Lab in her grade one to three classrooms right now, and so I pressed her to say why. Like what is the purpose of implementing Math Fact Lab? If that’s going to be, she’s putting a lot of time into it, a lot of energy, a lot of resources, and I said if that’s going to be your key result to increase usage of that platform between now and June, like how does that
help you get closer to your overall objective? Can you defend it using research and evidence? So that’s the point of the rationale. This column here, our hope is that as you’re gathering this evidence, so like when you do your pre-assessment with your K2s and you run your diagnostic for subtraction structures, link the data here so that this single document can house
all of the information that you need to essentially generate a report at the end of the year or summarize the work that you did as a team. So this is our evidence or our tracking of our key results and we’re going to actually document it or log it in this document. Here’s probably the most important part and maybe you want to move these over closer to the key result. Give me some feedback on that. But this is now your plan for how you’re going to achieve this.
So if you want to strengthen the use of a variety of strategies and models for K-2 students when solving subtraction problems, what’s the plan? What can you commit to to ensure that this result is achieved by the end of the year? So, you know, maybe it’s a half-day professional development session or multiple half days. Maybe they’re going to engage in a formative assessment cycle where they’re gonna bring evidence, you know, they’re gonna bring that data, that pre-assessment data to the table and we’re going to
you know, talk through the student thinking and learn a variety of strategies. Maybe they’re going to have coaching support. Maybe they’re going to engage in a book talk with figuring out fluency. This is what John was basically saying. It’s like your key result can only be as good as the commitments you’re able to make to it. And if you go through this process and you’re like, well, I actually can’t really commit very much to this key result.
maybe it’s not worth having as a key result this year. Maybe that’s a next year key result. Another thing we wanted to include is, who is the audience for this action? So is this for leaders? Is it for teachers? Is it for coaches? Is it for, you know, who are you going to target through that particular action? And then what is the subsystem?
So is it polo professional development? Is it through your PLC cycles? Is it your coaches? Is it a book talk? Is it other? And this one was developing resources for teachers, like on a website, for example, that they can access. We have due dates for all of these actions, as well as, you you can track the status of them and then ultimately click them as complete by the end of the year.
So that’s kind of an overview of this template or this progress tracking sheet. So I’m thinking about, I’m gonna use Annie as an example, because I’ve been working with Annie a lot recently trying to get things moving for next year. So one of Annie’s goals in Annie Jump in Any Time is hopefully to increase the effectiveness of the teacher collaboration time next year. And so a key result for Annie might be,
that 100 % of teachers engage in one lesson analysis or unit analysis formative assessment cycle and 100 % of teachers have positive feedback from that experience as measured by an exit ticket. Like that might be the key result for Annie next year because her goal next year is to strengthen their use of teacher collaboration time so that it’s more purposeful, meaningful, targeted to student learning. So that’s a key result.
But then the question is like, okay, how are going to make sure that happens? How are we going to ensure that 100 % of teachers engage in at least one impactful PLC cycle? Who are we putting in place to support that? What learning do we need to do? Is there a professional development day kickoff in August to, are we going to develop a district-wide template? Like all of the work that has to go into ensuring that is successful becomes your action steps.
that’s connected of course to what you want to achieve next year. All right that’s it for me, I’m done now I’m going to get off of my soapbox for a while.
Thanks For Listening
- Book a Math Mentoring Moment
- Apply to be a Featured Interview Guest
- Leave a note in the comment section below.
- Share this show on Twitter, or Facebook.
To help out the show:
- Leave an honest review on iTunes. Your ratings and reviews really help and we read each one.
- Subscribe on iTunes, Google Play, and Spotify.
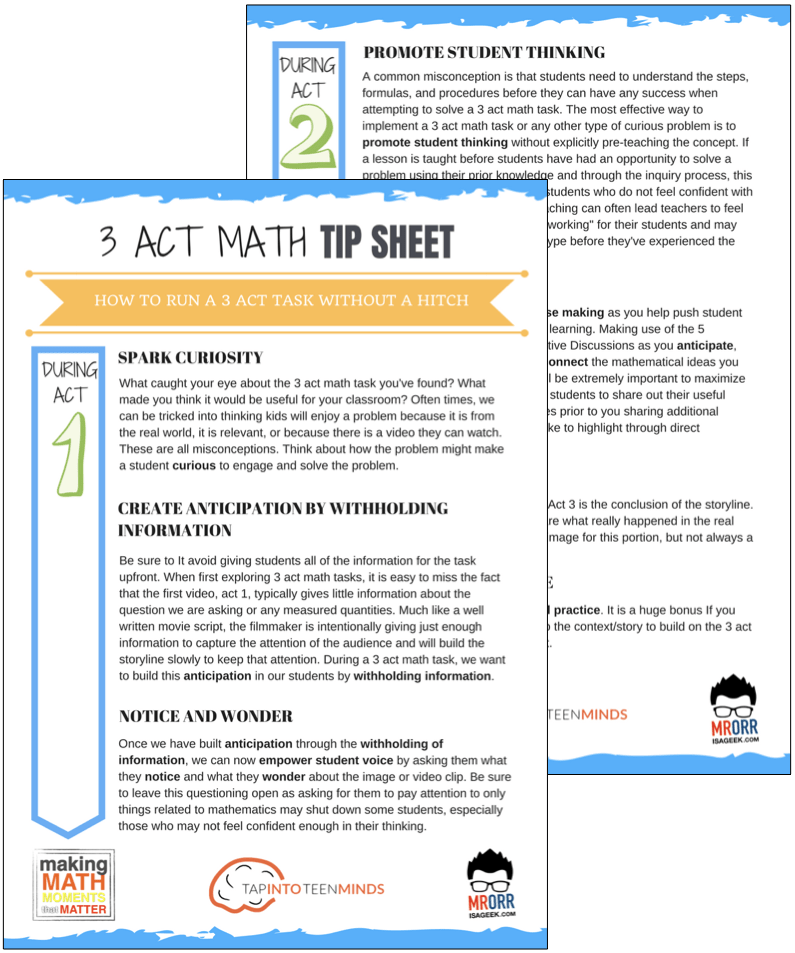
DOWNLOAD THE 3 ACT MATH TASK TIP SHEET SO THEY RUN WITHOUT A HITCH!
Download the 2-page printable 3 Act Math Tip Sheet to ensure that you have the best start to your journey using 3 Act math Tasks to spark curiosity and fuel sense making in your math classroom!
LESSONS TO MAKE MATH MOMENTS
Each lesson consists of:
Each Make Math Moments Problem Based Lesson consists of a Teacher Guide to lead you step-by-step through the planning process to ensure your lesson runs without a hitch!
Each Teacher Guide consists of:
- Intentionality of the lesson;
- A step-by-step walk through of each phase of the lesson;
- Visuals, animations, and videos unpacking big ideas, strategies, and models we intend to emerge during the lesson;
- Sample student approaches to assist in anticipating what your students might do;
- Resources and downloads including Keynote, Powerpoint, Media Files, and Teacher Guide printable PDF; and,
- Much more!
Each Make Math Moments Problem Based Lesson begins with a story, visual, video, or other method to Spark Curiosity through context.
Students will often Notice and Wonder before making an estimate to draw them in and invest in the problem.
After student voice has been heard and acknowledged, we will set students off on a Productive Struggle via a prompt related to the Spark context.
These prompts are given each lesson with the following conditions:
- No calculators are to be used; and,
- Students are to focus on how they can convince their math community that their solution is valid.
Students are left to engage in a productive struggle as the facilitator circulates to observe and engage in conversation as a means of assessing formatively.
The facilitator is instructed through the Teacher Guide on what specific strategies and models could be used to make connections and consolidate the learning from the lesson.
Often times, animations and walk through videos are provided in the Teacher Guide to assist with planning and delivering the consolidation.
A review image, video, or animation is provided as a conclusion to the task from the lesson.
While this might feel like a natural ending to the context students have been exploring, it is just the beginning as we look to leverage this context via extensions and additional lessons to dig deeper.
At the end of each lesson, consolidation prompts and/or extensions are crafted for students to purposefully practice and demonstrate their current understanding.
Facilitators are encouraged to collect these consolidation prompts as a means to engage in the assessment process and inform next moves for instruction.
In multi-day units of study, Math Talks are crafted to help build on the thinking from the previous day and build towards the next step in the developmental progression of the concept(s) we are exploring.
Each Math Talk is constructed as a string of related problems that build with intentionality to emerge specific big ideas, strategies, and mathematical models.
Make Math Moments Problem Based Lessons and Day 1 Teacher Guides are openly available for you to leverage and use with your students without becoming a Make Math Moments Academy Member.
Use our OPEN ACCESS multi-day problem based units!
Make Math Moments Problem Based Lessons and Day 1 Teacher Guides are openly available for you to leverage and use with your students without becoming a Make Math Moments Academy Member.
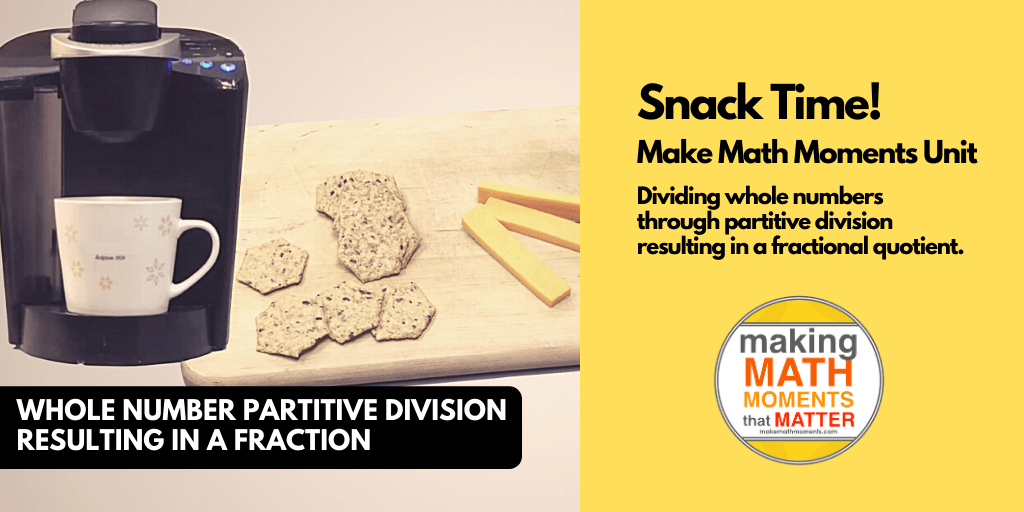
Partitive Division Resulting in a Fraction
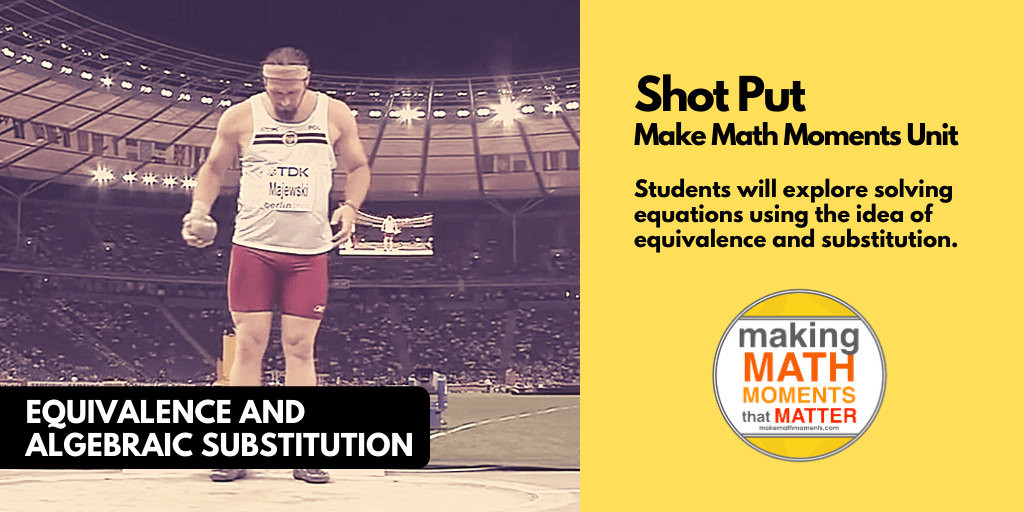
Equivalence and Algebraic Substitution
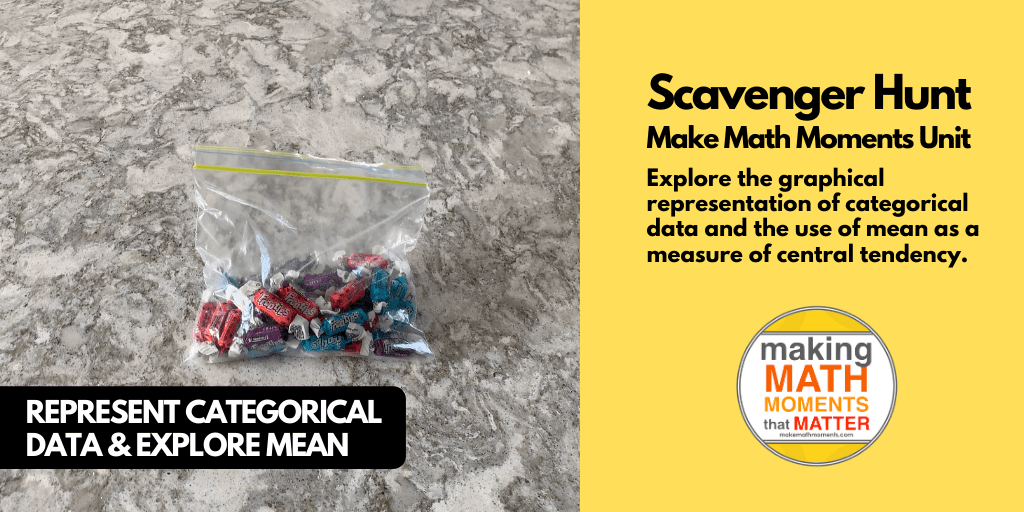
Represent Categorical Data & Explore Mean
Downloadable resources including blackline masters, handouts, printable Tips Sheets, slide shows, and media files do require a Make Math Moments Academy Membership.
ONLINE WORKSHOP REGISTRATION
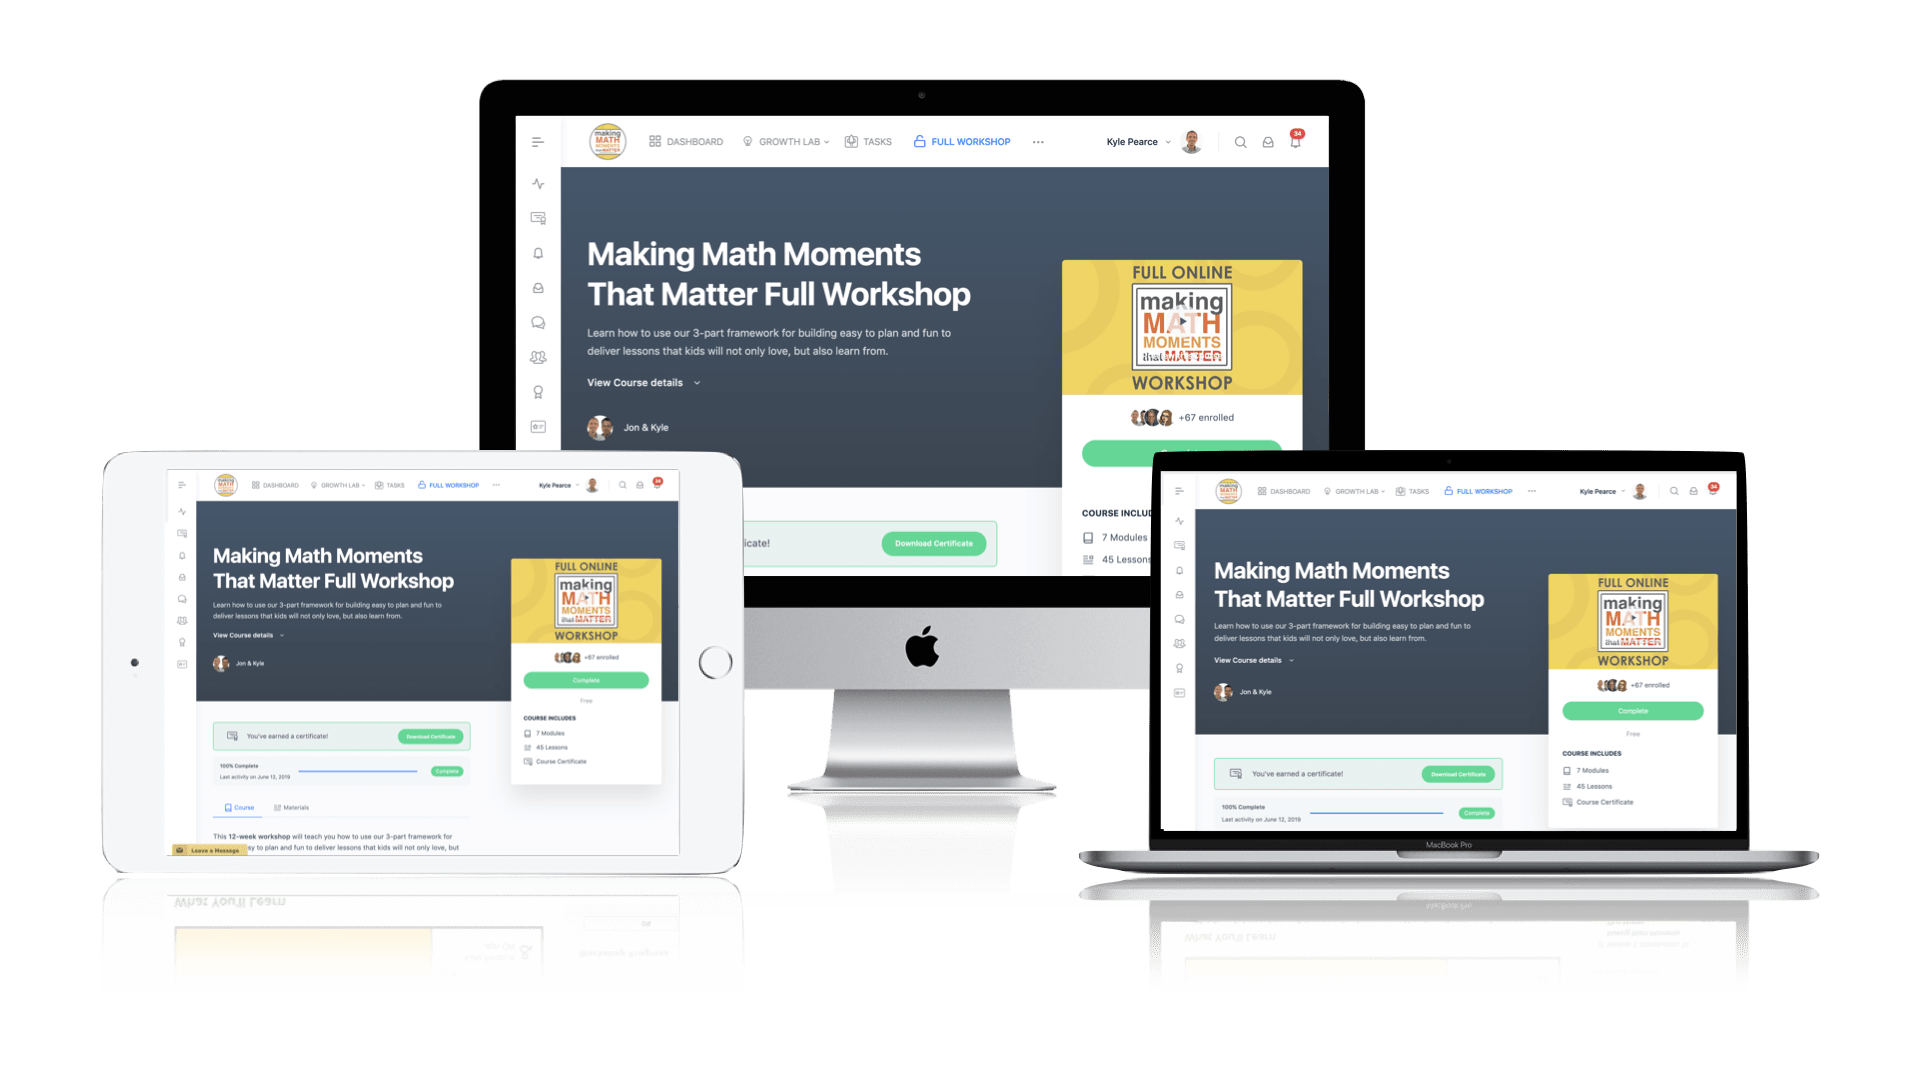
Pedagogically aligned for teachers of K through Grade 12 with content specific examples from Grades 3 through Grade 10.
In our self-paced, 12-week Online Workshop, you'll learn how to craft new and transform your current lessons to Spark Curiosity, Fuel Sense Making, and Ignite Your Teacher Moves to promote resilient problem solvers.


0 Comments